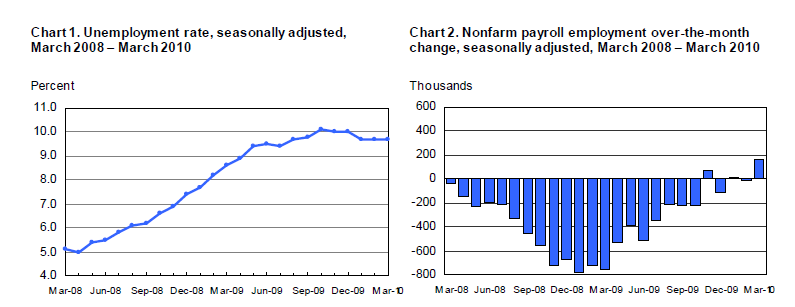
Nonfarm payroll employment increased by 162,000 in March, below consensus expectations but still the largest gain in payrolls since March 2007. 48,000 of the 162,000 jobs were census workers. January nonfarm payrolls were revised to +14,000 from -26,000, that's a 40k swing. The unemployment rate held steady at 9.7 percent

Temporary help services and health care continued to add jobs over the month. Employment in federal government also rose, reflecting the hiring of temporary workers for Census 2010. Employment continued to decline in financial activities and in information.
Household Survey
- the labor force is growing as job seekers see economic conditions improving
- the number of unemployed persons was little changed at 15.0 million
- the number of long-term unemployed (those jobless for 27 weeks and over) increased by 414,000 over the month to 6.5 million. 44.1 percent of unemployed persons were jobless for 27 weeks or more. THIS IS BAD!
- the number of persons working part time for economic reasons (sometimes referred to as involuntary part-time workers) increased to 9.1 million in March. These individuals were working part time because their hours had been cut back or because they were unable to find a full-time job.
- there were 1.0 million discouraged workers in March, up by 309,000 from a year earlier. (The data are not seasonally adjusted.) Discouraged workers are persons not currently looking for work because they believe no jobs are available for them. THIS IS BAD!
Establishment Survey
- Nonfarm payroll employment rose by 162,000
- Hours worked rose from 33.1 to 33.3 Average hourly earnings fell from 18.92 to 18.90. THIS IS BAD!
- Temporary help services added 40,000 jobs in March. Since September 2009, temporary help services employment has risen by 313,000.
- Health care continued to increase in March (27,000), with the largest gains occurring in ambulatory health care services (16,000) and in nursing and residential care facilities (9,000).
- Employment in mining increased by 8,000. Monthly job gains in mining have averaged 6,000 over the past 5 months.
- Employment in federal government was up over the month, reflecting the hiring of 48,000 temporary workers for the decennial census.
- Manufacturing employment continued to trend up in March (17,000); the industry has added 45,000 jobs in the first 3 months of 2010. Over the month, job gains were concentrated in fabricated metal products
(9,000) and in machinery (6,000). - Employment in construction held steady (15,000) in March. The industry had lost an average of 72,000 jobs per month in the prior 12 months.
- Over the month, employment changed little in transportation and warehousing, leisure and hospitality, retail trade, and wholesale trade.
- In March, financial activities shed 21,000 jobs, with the largest losses occurring in insurance carriers and related activities (-9,000). Employment in the information industry decreased by 12,000.
Plain and Simple: There's ammo for both bulls and bears in this data. Revisions to previous data add 40,000 more jobs than previously reported. Census workers spend money just like every other American consumer, but the 500,000 or so jobs the government creates for the census will only last for the next 6 months. The labor force is growing, meaning people see an opportunity to get a job and they are going for it. That sentiment is reflected in growth of the "temporary help" sector. Unfortunately those folks are having to take less pay. This implies deflation is still a concern. The construction industry saw "job creation" for the first time since June 2007...horrible winter weather in February will be cited as the reason for the rebound though. Manufacturing jobs were added...again, weather related or structural growth?? All in all it's a mixed report and there aren't many traders in the pits to care....
My biggest issue: the number of people out of a job for longer than 27 weeks continues to rise, now at 6.5 million people. 44.1 percent of the unemployed have been out of a job for more than 27 weeks. U-6 rose again....
The initial reaction in markets....
The 3.625% coupon bearing 10 year TSY note is -0-14 at 97-18 yielding 3.921% This is a KEY TECHNICAL SUPPORT LEVEL!!! We do not want to break this pivot...but if we do today it doesnt mean all that much. The market is "bid wanted"...all sellers no buyers
The FN 4.5 is -0-08 at 99-18 yielding 4.563%. My scorecard has the secondary market current coupon at 4.575% and yield spreads slightly tighter in the down trade. This is to be expected when TSYs sell off.
Markets are very thinly attended today with major decision makers "phoning it in" at most. Those left to man the desk have been given strict instructions to let the market go where it pleases....don't try and catch a falling knife! The lack of liquidity makes it hard to determine the market's true bias.
Plain and Simple: bonds are selling but there aren't many traders around who are willing and able to stop the bleeding. Lots of offers, bids wanted.... all sellers, no buyers
The bond market closes at noon. Traders checked out at 900am.....


