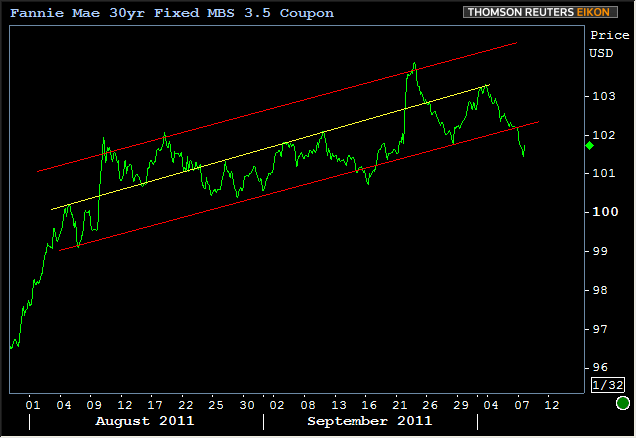
Better than expected Non-Farm-Payrolls number... Fairly sizeable sell-off earlier in the day (though possibly stabilizing now)... Given that we mentioned both MBS and Treasuries as being at the weaker limits of their recent ranges yesterday, it's fair to assume that those trends would be at risk of breaking with today's sell-off. But remember that there are two components to the breaking of a trend: the "test" and the "confirmation."
In the test phase, we see the the charted security provide a signal. This can be as simple as the price or yield of a security breaking a trendline, but can also occur on more complex chart studies such as a stochastic cross, a candlestick formation, or break out of an Ichimoku cloud. You don't need to know what any of those mean, simply that the "TEST" means that charts or technical studies applied to those charts have given some sort of signal that things might be changing. In the case of the trends we've been following, this signal is as simple as the charts crossing outside the trendlines.
But the test in and of itself isn't necessarily a break of the trend until it's confirmed. Confirmation can come in a couple different forms, but when we're talking about the break of a trendline (especially one that occurs on a NFP Friday before a 3-day weekend), we'd like to see that prices and/or yields indeed hold the breakouts on Tuesday before confirming the trend. We'd also like to see prices/yields return to the scene of the crime to bounce on the other side of the trendline (one man's floor, another man's ceiling). In other words, MBS and Treasuries have bumped up against the outer limits of the trend channels below so many times that if we're truly going to consider them broken, it would be nice if the charts would show us that they're serious about that breakout by coming back toward the trendlines they just broke but bouncing on them and continuing to trade outside the previous trend in higher volume. Maybe a picture would help illustrate this... LIKE THIS:

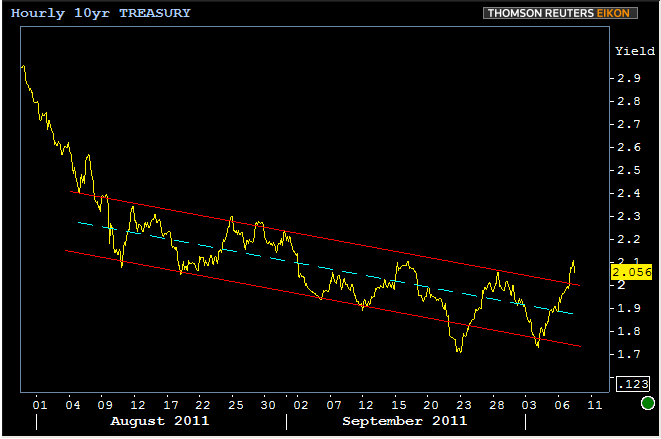
For the record, there are other methods of confirmation, but this is one of the best confirmations of a breakout of a simple trendline. All of the above has hopefully prepared you to view the following disturbing images with a grain of salt. Yes, our beloved trend channels are broken... Or at least undergoing a test for a breakout... Either way... Not fun today...

And in 10yr yields...

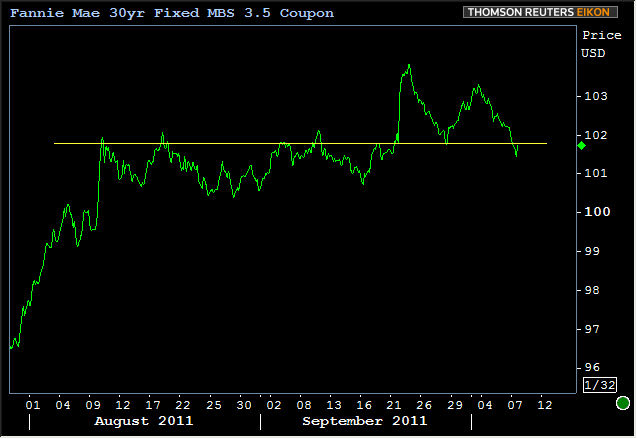
You might notice that each of these trends have experienced breakouts in the recent past that were ultimately NOT confirmed. In other words, prices/yields closed outside the trend on one trading session, but moved back into the trend channel on the next. That's what we're HOPING will happen on Tuesday, but if it doesn't, we'd turn next to an assessment of a SIDEWAYS trend, by way of transition from the recent diagonal trends. Two significant horizontal lines emerge in that case. For MBS, it would clearly be the old "concrete ceiling" levels that we're currently hovering around (101-25 officially in Fannie 3.5's, but on long term charts, a deviation of a few ticks still works).

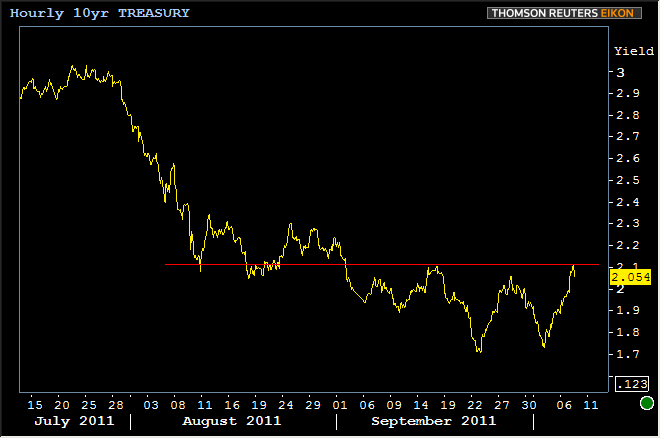
Similar story in treasuries with the level that I referred to about a month ago as the most frequently recurring market bottom for 10yr yields in August, or "the modal low." After a definitive break lower from 2.125, 10yr yields have yet to go above, and had major bounced in mid September and again today (twice).

Long story short, we're not suggesting these "predict the future" and are more likely than not to offer support against rising TSY yields or falling MBS prices, but rather, they are important lines in the sand that would let us know if trends are reversing. If we sprinkle in some market fundamentals to the above mix of technical analysis, I think most of our audience--myself included--doubts that the fundamentals yet suggest that trends are LIKELY to reverse in the big picture. But beware the cognitive "confirmation bias" and remember anything's possible.


