Bond markets continued to tiptoe around the task of hinting at any forceful commitment in one direction or another yesterday, and clues were in short supply. As we pondered last week, the general tone of the fixed income sector (at least the part that we, as MBS watchers, are concerned with) is either returning to test it's previous range or is in the process of ratcheting higher.
It's a pretty big "if," and a more than just another attempt to approach our analysis from a balanced point of view. The reason things are more serious this time has to do with where we are with respect to past levels. 10yr yields spent almost 5 months doing the SAME thing and for the past 3 weeks have been doing something completely DIFFERENT.
Think of it like a college student growing up his whole life in the same house who abruptly moved out to further his education. After graduation will he move back home or move on with his life? That's what we're trying to figure out at the moment... If you like low rates, assume you're the overprotective parents who want him to stay home as long as possible...
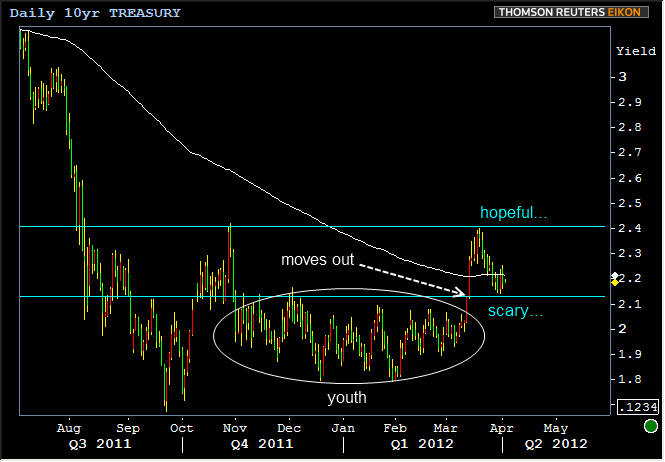
Now tying this together with real market levels (in 10yr Treasury yields), our college student was born on 11/1/11 and spent his "youth" (circled in the following chart) in a house whose walls were at 2.13 and 1.90, and a back yard that ran all the way to 1.80. He "moved out" (also noted in the following chart) on 3/13/12 and went as far as 2.40. We're encouraged by the fact that he went no further than that ("hopeful" in the chart), but concerned by the fact that he's recently returned right to our doorstep without actually crossing the threshold ("scary" in the chart).

Shifting away from the analogy now, this is pretty serious stuff and there are serious reasons to be conflicted about what happens next. We've also noted serious disparity of opinion and trading strategies in capital markets, giving us the impression that the debate isn't one of those things that's already been decided and simply needs time to bear out. We really do think it could go either way.
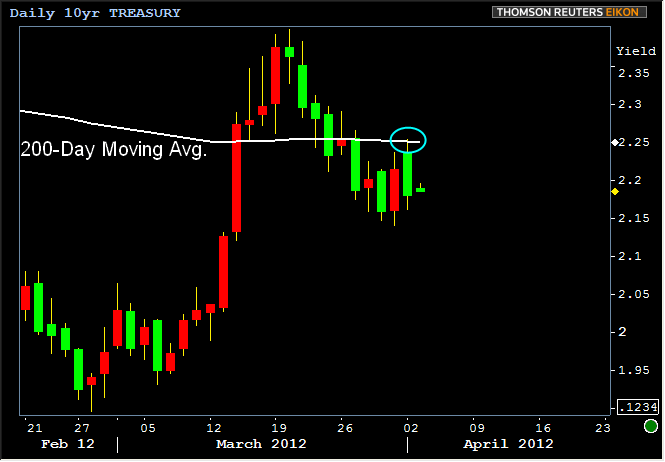
The biggest, nastiest cause for concern is already seen in the chart above (the "scary" line). That's not the sort of pivot point we'd just want to dismiss as temporary without confirmation of that fact, especially given that 10yr yields really seemed to grind to a halt around those levels. On the other side of the coin, and in addition to the promising bounce at 2.40, there's "stuff" like the 200 day moving average acting as support in the overnight session to begin the current week:

There are several other ways to measure the indecision, but this good, old fashioned TRIANGLE is one of the clearest and simplest. Triangle show two competing trends. One of them has to win out eventually as the trends collide at the apex of the implied triangle. Please note that these recently converging trends will be forced to decide who wins by precisely 2pm tomorrow: FOMC Meeting Minutes time.

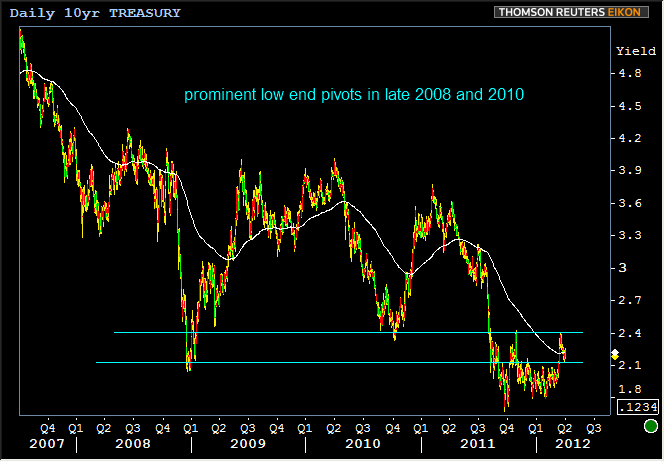
Even if you're not quite ready to agree that the technical clues about trading sentiment really get so specific that trendlines target the release times of economic events (we wouldn't blame you... We're not sure we agree either, but it's fun to think about), at least we can agree that the upper and lower limits of the recent range are historically important in a broad, general sense. We're basically looking at 2008 lows as a low end pivot for the current range and 2010 lows as the high end.

Ok ok ok... If you promise to acquiesce to the possibility that current levels are somewhat significant and that recent trading hasn't given a firm signal as to what happens next, then we promise to stop being quite so thorough in suggesting that fact. Bottom line, it's decision time, or soon will be. The decision could be a gradual thing or it could be brutal. But the decision making process could get some useful info from FOMC minutes today at 2pm. Combined with Friday's NFP, maybe even enough info to figure out just what the heck is going on.
The morning brings ISM New York at 9:45am and Factory Orders at 10:00am, but neither are likely to cause a meaningful shift in levels, at least not to the same extent as FOMC data at 2pm, as well as the rest of the week's data. Keep in mind, any time we're talking about big potential movement, "potential" is a key word. Sometimes these things don't live up to the hype. Sometimes the reaction is delayed.
|
Week Of Mon, Apr 2 2012 - Fri, Mar 6 2012 |
||||||
|
Time |
Event |
Period |
Unit |
Forecast |
Prior |
Actual |
|
Mon, Apr 2 |
||||||
|
10:00 |
Construction spending |
Feb |
% |
+0.6 |
-0.1 |
-1.1 |
|
10:00 |
ISM Manufacturing Purchasing Managers Index |
Mar |
-- |
53.0 |
52.4 |
53.4 |
|
10:00 |
ISM Mfg Prices Paid |
Mar |
-- |
63.0 |
61.5 |
61.0 |
|
Tue, Apr 3 |
||||||
|
09:45 |
ISM-New York index |
Mar |
-- |
-- |
543.1 |
-- |
|
10:00 |
Factory orders mm |
Feb |
% |
+1.5 |
-1.0 |
-- |
|
14:00 |
FOMC Minutes (March 13th Meeting) |
-- |
-- |
-- |
-- |
-- |
|
Wed, Apr 4 |
||||||
|
07:00 |
Mortgage market index |
w/e |
-- |
-- |
663.7 |
-- |
|
07:00 |
Mortgage refinance index |
w/e |
-- |
-- |
3438.6 |
-- |
|
08:15 |
ADP National Employment |
Mar |
k |
+200 |
+216 |
-- |
|
10:00 |
ISM Non-Mfg Business Activity |
Mar |
-- |
62.0 |
62.6 |
-- |
|
10:00 |
ISM Non-Manufacturing PMI |
Mar |
-- |
57.0 |
57.3 |
-- |
|
Thu, Apr 5 |
||||||
|
07:30 |
Challenger layoffs |
Mar |
k |
-- |
57,728 |
-- |
|
08:30 |
Initial Jobless Claims |
w/e |
k |
355 |
359 |
-- |
|
08:30 |
Continued jobless claims |
w/e |
ml |
3.35 |
3.34 |
-- |
|
Fri, Apr 6 |
||||||
|
08:30 |
Non-farm payrolls |
Mar |
k |
+201 |
+227 |
-- |
|
08:30 |
Manufacturing payrolls |
Mar |
k |
+20 |
+31 |
-- |
|
08:30 |
Private Payrolls |
Mar |
k |
+218 |
+233 |
-- |
|
08:30 |
Unemployment rate mm |
Mar |
% |
8.3 |
8.3 |
-- |
|
08:30 |
Average earnings mm |
Mar |
% |
+0.2 |
+0.1 |
-- |
|
12:00 |
Bond Market Early Close |
-- |
-- |
-- |
-- |
-- |
|
15:00 |
Consumer credit |
Feb |
bl |
+12.25 |
+17.78 |
-- |


