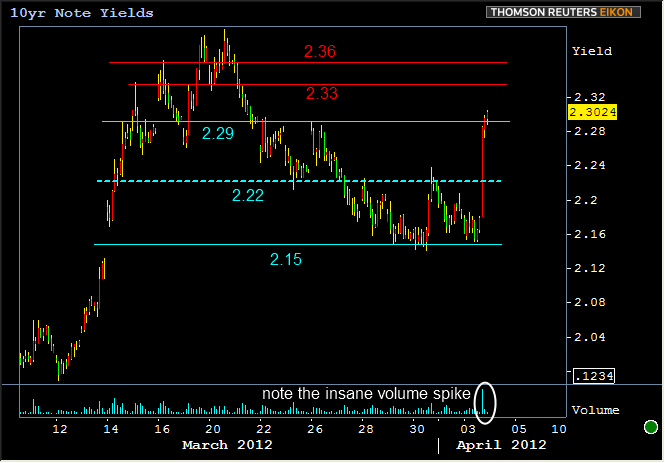
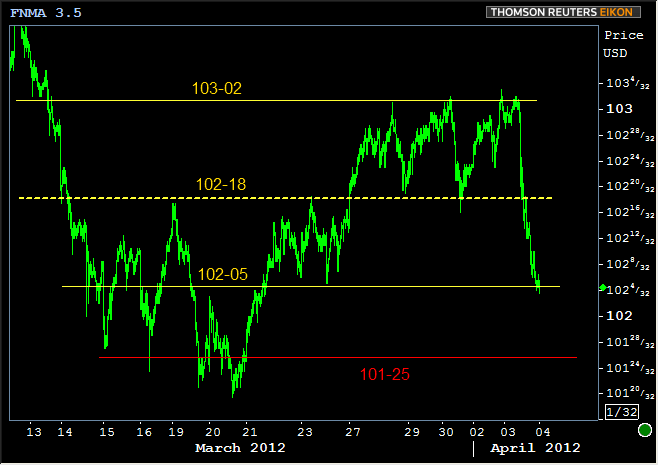
MBS went cliff-diving on Tuesday following the release of the FOMC Minutes from the 3/13/11 meeting. Interesting that it was the 3/13/11 meeting that initially marked the turning point for bond markets when 10yr yields broke north of 2.13. At that time, the run up to 2.40 was part of a perfect storm of the FOMC Announcement and surrounding events.

This time, we haven't sold off quite as much, but we also did most of the selling-off in a single hour as opposed to spaced over two days (check out the insane volume spike! Insane I tell you!). It was incredibly violent. Such violence usually IS NOT followed by calm, sideways movement. If we were trading in a vacuum devoid of news and data for the remainder of the week, another visit to something near 2.40 is clearly indicated by historical examples of similar moves.
But we're not trading in a vacuum. Another test of 2.40 is a very real threat, but so is another visit to mess around with the lower end of the recent range. Incidentally, we see the "recent range" as something like 2.15 to 2.29 (as seen in the previous chart. And yes, we're very aware that we've traded into 2.14's and much higher than 2.29's recently).
Whether or not we make a run at the higher end of the range depends a lot on Friday's jobs data. And the anticipatory trading that leads up to Friday's jobs data has increasingly been informed by Wednesday's ADP report (like it or not). And Wednesday's ADP report is today! So "buckle up and let's see where it takes us" is the general message we're driving at here.
Don't give up hope, but also don't kid yourself that things could get ugly. Here's one more chart showing some of the recent pivot points for MBS. Like the Treasury chart above, we put the core range as resting right on today's lows. The moral of that story is that we think that today's data would have to confirm further bond-market bearishness in order to get a test of 101-25-ish in the same way that it would be required for 10's to test pivots at 2.33 and 2.36.

Feel free to check the rest of the econ calendar and notice ISM non-manufacturing hits today as well. It has an "employment component" that could be of some interest to us, but only inasmuch as it helps bring the picture of Friday's jobs report slightly more into focus.
|
Week Of Mon, Apr 2 2012 - Fri, Mar 6 2012 |
||||||
|
Time |
Event |
Period |
Unit |
Forecast |
Prior |
Actual |
|
Mon, Apr 2 |
||||||
|
10:00 |
Construction spending |
Feb |
% |
+0.6 |
-0.1 |
-1.1 |
|
10:00 |
ISM Manufacturing Purchasing Managers Index |
Mar |
-- |
53.0 |
52.4 |
53.4 |
|
10:00 |
ISM Mfg Prices Paid |
Mar |
-- |
63.0 |
61.5 |
61.0 |
|
Tue, Apr 3 |
||||||
|
09:45 |
ISM-New York index |
Mar |
-- |
-- |
543.1 |
551.8 |
|
10:00 |
Factory orders mm |
Feb |
% |
+1.5 |
-1.0 |
+1.3 |
|
14:00 |
FOMC Minutes (March 13th Meeting) |
-- |
-- |
-- |
-- |
-- |
|
Wed, Apr 4 |
||||||
|
07:00 |
Mortgage market index |
w/e |
-- |
-- |
663.7 |
-- |
|
07:00 |
Mortgage refinance index |
w/e |
-- |
-- |
3438.6 |
-- |
|
08:15 |
ADP National Employment |
Mar |
k |
+200 |
+216 |
-- |
|
10:00 |
ISM Non-Mfg Business Activity |
Mar |
-- |
62.0 |
62.6 |
-- |
|
10:00 |
ISM Non-Manufacturing PMI |
Mar |
-- |
57.0 |
57.3 |
-- |
|
Thu, Apr 5 |
||||||
|
07:30 |
Challenger layoffs |
Mar |
k |
-- |
57,728 |
-- |
|
08:30 |
Initial Jobless Claims |
w/e |
k |
355 |
359 |
-- |
|
08:30 |
Continued jobless claims |
w/e |
ml |
3.35 |
3.34 |
-- |
|
Fri, Apr 6 |
||||||
|
08:30 |
Non-farm payrolls |
Mar |
k |
+201 |
+227 |
-- |
|
08:30 |
Manufacturing payrolls |
Mar |
k |
+20 |
+31 |
-- |
|
08:30 |
Private Payrolls |
Mar |
k |
+218 |
+233 |
-- |
|
08:30 |
Unemployment rate mm |
Mar |
% |
8.3 |
8.3 |
-- |
|
08:30 |
Average earnings mm |
Mar |
% |
+0.2 |
+0.1 |
-- |
|
12:00 |
Bond Market Early Close |
-- |
-- |
-- |
-- |
-- |
|
15:00 |
Consumer credit |
Feb |
bl |
+12.25 |
+17.78 |
-- |


