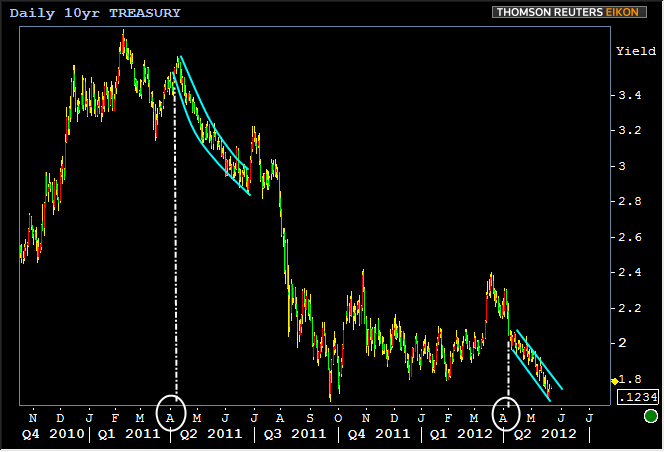
Overnight volume leading into yesterday's session made it seem like it might turn out surprisingly strong, but Treasury trading around 4am New York time turned out to be the most exciting of the day, leaving domestic working hours to short of chop sideways very uneventfully very much INSIDE (lower highs and higher lows) the extremes from the previous 2 days of trading.
Production MBS didn't much care for it and after trying to hold sideways in the morning, basically gave up in the afternoon. That said, the damage was minimal with only a few ticks separating highs and lows. In fact that's the broader trend for bond markets in general. Volatility continues to be very well contained. Despite the aggressive outright levels, the manner in which we've arrived here has been just as uneventful and orderly as it was last spring.
Is there something to this "volatile in March, then let the rally begin a few days into April" thing we've been hearing so much about?

Even though we won't believe that this year's spring rally will be like last year's until we see it, so far they've shared that same sort of "move along, nothing to see here" vibe. It's been sorta like "sell in May and go away," except more of a "buy Treasuries in early April and keep doing that slowly but surely until further notice."
The presence of the broader rallying trend seen above has gone some way toward putting the past two sessions of relative weakness in a less threatening context. Granted, if we find ourselves trading through the upper teal line in the above chart or the lower support levels in MBS prices, we might sing a different tune, but for now the ups and downs of this song are well-rehearsed.
Add to that the fact that markets don't seem eager to sing any of their recent notes too loudly with what will turn out to be a very harsh critic or very enthusiastic fan in the audience. To drop the analogy, June's FOMC meeting and Greek vote are the next big venues for potentially major shifts (next week's NFP could easily serve as a major suggestion as to how the FOMC Announcement will evolve though). Either we're looking at a situation where no one wants to catch those falling knives or it's just 'late spring.'
Today brings Existing Home Sales as the key data-set at 10am, as well as the Richmond Fed Index. The latter isn't even meaty enough to make our econ calendar while the former only does so because it's 'mortgage market related.' By virtue of the same sort of rule, the 2yr Note Auction is also on the calendar at 1pm, though these things haven't moved markets since the Fed pinned short end rates down back in August 2011.
|
Week Of Mon, May 21 2012 - Fri, May 25 2012 |
||||||
|
Time |
Event |
Period |
Unit |
Forecast |
Prior |
Actual |
|
Mon, May 21 |
||||||
|
08:30 |
National Activity Index |
Apr |
-- |
-- |
-0.29 |
+.11 |
|
Tue, May 22 |
||||||
|
10:00 |
Existing home sales |
Apr |
ml |
4.6 |
4.48 |
-- |
|
10:00 |
Exist. home sales % chg |
Apr |
% |
+3.1 |
-2.6 |
-- |
|
13:00 |
2-Yr Note Auction |
-- |
bl |
35.0 |
-- |
-- |
|
Wed, May 23 |
||||||
|
07:00 |
Mortgage market index |
w/e |
-- |
-- |
775.6 |
-- |
|
07:00 |
Mortgage refinance index |
w/e |
-- |
-- |
4219.1 |
-- |
|
10:00 |
Monthly Home Price mm |
Mar |
% |
-- |
+0.3 |
-- |
|
10:00 |
Monthly Home Price yy |
Mar |
% |
-- |
+0.4 |
-- |
|
10:00 |
New home sales-units mm |
Apr |
ml |
.335 |
.328 |
-- |
|
10:00 |
New home sales chg mm |
Apr |
% |
-- |
-7.1 |
-- |
|
13:00 |
5-Yr Treasury Auction |
-- |
bl |
35.0 |
-- |
-- |
|
Thu, May 24 |
||||||
|
08:30 |
Durable goods |
Apr |
% |
+0.5 |
-4.0 |
-- |
|
08:30 |
Initial Jobless Claims |
w/e |
k |
370k |
370k |
-- |
|
08:30 |
Continued jobless claims |
w/e |
ml |
3.25 |
3.265 |
-- |
|
13:00 |
7-Yr Note Auction |
-- |
bl |
29.0 |
-- |
-- |
|
Fri, May 25 |
||||||
|
09:55 |
U.Mich sentiment |
May |
-- |
77.8 |
77.8 |
-- |
|
09:55 |
U Mich conditions |
May |
-- |
87.1 |
87.3 |
-- |
|
09:55 |
U.Mich expectation |
May |
-- |
71.5 |
71.7 |
-- |
|
* mm: month over month | yy: year over year | qq: quarter over quarter * (n)SA: (non) Seasonally Adjusted * PMI: "Purchasing Managers Index" |
||||||


