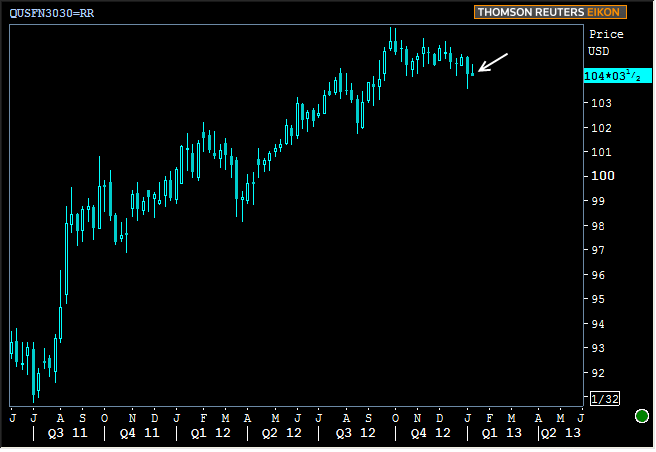
Thursday could have been a better day for bond markets... It could have marked bounce back below important technical levels in 10yr yields (lots of focus this week on Treasuries vs MBS due not only to the monthly MBS Settlement making MBS-specific technical analysis less reliable, but also that bigger potential shifts are being considered, and benchmark Treasuries will continue to be broad strokes comprising the interest rate picture). 10yr yields could have taken the opportunity today to push down below 1.865, and by failing to do that, the current week of trading is at real risk of confirming that a longer term trend of weakness remains intact since the summer months.
Below is a chart of WEEKLY candlesticks for 10yr yields. Green candles mean yields moved down, red means up. The yellow lines are the week's absolute highs and lows while the rectangular bodies mark the open and the close.

Note the big nasty red candles in August and September. Then see that the following weeks pushed yields back lower. Attack, counterattack, life goes on in low rate land...
Now note March 2012. Biggest, nastiest red candle on the chart, but the following week managed to open in line with "big red's" closing mark and make slight improvements. After another excruciating week of indecision, rates finally returned to previous levels before the prolonged rally into the summer months. But if Friday isn't a rip-roaring romp lower in yield, it will be the first time , the VERY FIRST TIME since the major rates rally began in mid 2011 that weekly charts have closed at multi-month highs for two consecutive weeks. (By the way, the solid teal line is a simple linear regression from record low close at the beginning of June that may end up marking a longer term low for Treasury yields than fans of low interest rates might like).
Bottom line, there's a lot at stake here, and while the technical developments aren't a guarantee of pain in the near term future, they're not exactly screaming "all aboard" the float boat. We could point to instances in early 2010 where similar weeks of movement resulted in markets ultimately calming down and moving back to previous rates, but even then, the longer term trends were pointed toward higher rates until the European crisis exploded onto the scene.
All that having been said, as you can see in the teal lines above, even an upward trend in rates leaves a lot of room for corrections back to the mid-point. Entertaining the possibility that this trend continues isn't to give up on low rates forever, but it does suggest a certain seriousness in identifying opportunities to protect yourself should that prove to be the case. Thankfully, THIS is where we are in MBS, even after the roll:

|
Week Of Mon, Jan 7 2012 - Fri, Jan 11 2012 |
|||||
|
Time |
Event |
Period |
Unit |
Forecast |
Prior |
|
Mon, Jan 7 |
|||||
|
-- |
No Significant Scheduled Data |
-- |
-- |
-- |
-- |
|
Tue, Jan 8 |
|||||
|
13:00 |
3-Yr Note Auction |
-- |
bl |
32.0 |
-- |
|
15:00 |
Consumer credit |
Nov |
bl |
11.25 |
14.20 |
|
Wed, Jan 9 |
|||||
|
13:00 |
10yr Treasury Auction |
-- |
bl |
21.0 |
-- |
|
Thu, Jan 10 |
|||||
|
08:30 |
Initial Jobless Claims |
-- |
k |
365 |
372 |
|
10:00 |
Wholesale Inventories |
Nov |
% |
+0.3 |
+0.6 |
|
13:00 |
30-Yr Treasury Auction |
-- |
bl |
13.0 |
-- |
|
Fri, Jan 11 |
|||||
|
08:30 |
Import/Export prices mm |
Dec |
% |
.1 / 0.0 |
-0.9 / -0.7 |
|
08:30 |
International Trade |
Nov |
bl |
-41.3 |
-42.24 |
|
* mm: monthly | yy: annul | qq: quarterly | "w/e" in "period" column indicates a weekly report * Q1: First Quarter | Adv: Advance Release | Pre: Preliminary Release | Fin: Final Release * (n)SA: (non) Seasonally Adjusted * PMI: "Purchasing Managers Index" |
|||||


