Today is the last before the event we've been waiting for since May 22nd. It was that dose of unexpectedly candid taper talk from Bernanke (later emphasized by FOMC Minutes) that sent bond markets into a tailspin, with 10yr yields crossing into ominous territory over 2.07 and MBS growing progressively weaker by comparison. Incidentally, the latter was discussed in greater detail yesterday morning (HERE), and if you haven't seen it yet, I'd start there.
That brings us to a tight spot where MBS are reliant upon NFP turning the tide of Fed tapering sentiment in order to get any relief between now and the Announcement on June 19th. Today then, is merely to be endured as we wait for tomorrow's NFP. Of course, there's always a risk of volatility posed by the ECB Announcement and press conference, as well as Jobless Claims, but even if those cause a stir, NFP can undo anything they create.
In other words, even if today's data manages to break the recent range, it would be like bending a tree branch in either direction, but not being able to break it. Speaking of tree branches, Treasuries have finally made a meaningful gesture to move outside May's uptrend in yield, but the more significant barrier remains the 2.04-2.07 gap. In that sense, 10's maybe be "going out on a limb" in the chart below (if this breaks today, it would still need to "stay broken" on Friday to confirm a break from a technical perspective).

A few other charts and thoughts to pass the time until 8:30am on Friday:
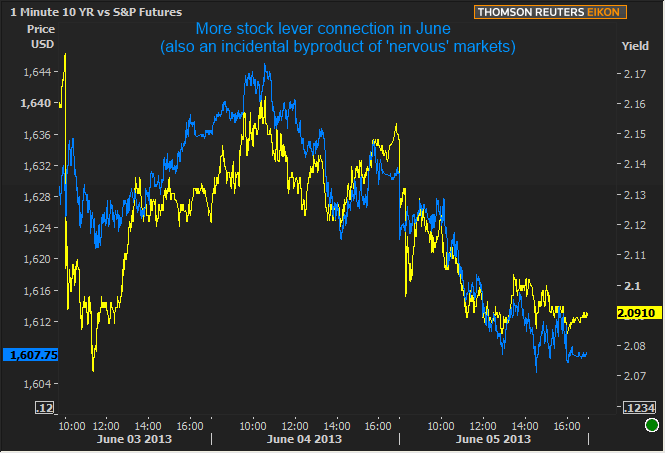
Stocks and bonds may continue to exhibit better correlation, as has been increasingly the case the closer we've gotten to the end of the week:

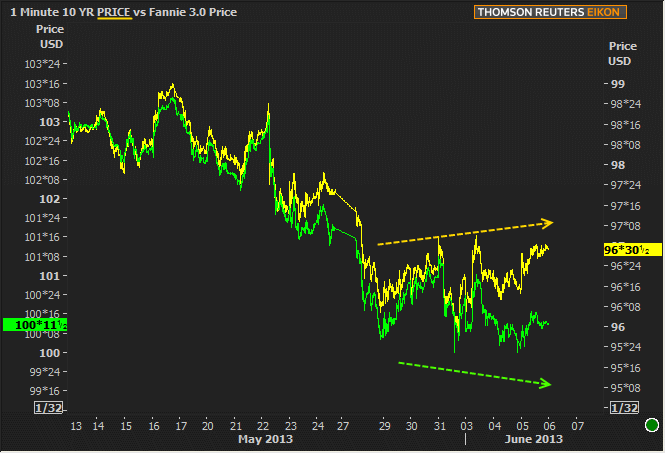
Finally, just another view of the recent MBS-specific pain. Keep in mind that Treasuries are displayed in PRICE in the chart below so that it's easier to see the divergence. If it feels weird to think of 10yr yields in terms of price, and assuming low rates are good, then just remember "up = good" for both of the lines on the chart.

|
Week Of Mon, Jun 3 2013 - Fri, Jun 7 2013 |
|||||
|
Time |
Event |
Period |
Unit |
Forecast |
Prior |
|
Mon, Jun 3 |
|||||
|
08:58 |
Markit Manufacturing PMI |
May |
-- |
-- |
51.9 |
|
10:00 |
Construction spending |
Apr |
% |
1.0 |
-1.7 |
|
10:00 |
ISM Manufacturing |
May |
-- |
50.5 |
50.7 |
|
Tue, Jun 4 |
|||||
|
08:30 |
International Trade |
Apr |
bl |
-41.0 |
-38.8 |
|
Wed, Jun 5 |
|||||
|
07:00 |
MBA Mortgage market index |
w/e |
-- |
-- |
721.4 |
|
08:15 |
ADP National Employment |
May |
k |
160 |
119 |
|
08:30 |
Productivity Revised |
Q1 |
% |
0.7 |
0.7 |
|
08:30 |
Labor costs Revised |
Q1 |
% |
0.5 |
0.5 |
|
10:00 |
ISM N-Mfg PMI |
May |
-- |
53.3 |
53.1 |
|
10:00 |
ISM N-Mfg Bus Act |
May |
-- |
55.0 |
55.0 |
|
10:00 |
Factory orders mm |
Apr |
% |
1.5 |
-4.9 |
|
Thu, Jun 6 |
|||||
|
08:30 |
Initial Jobless Claims |
w/e |
k |
345 |
354 |
|
Fri, Jun 7 |
|||||
|
08:30 |
Non-Farm Payrolls |
May |
k |
160 |
165 |
|
08:30 |
Unemployment rate mm |
May |
% |
7.5 |
7.5 |
|
08:30 |
Average workweek hrs |
May |
hr |
34.5 |
34.4 |
|
08:30 |
Average earnings mm |
May |
% |
0.2 |
0.2 |
|
15:00 |
Consumer credit |
Apr |
bl |
12.50 |
7.97 |
|
* mm: monthly | yy: annual | qq: quarterly | "w/e" in "period" column indicates a weekly report * Q1: First Quarter | Adv: Advance Release | Pre: Preliminary Release | Fin: Final Release * (n)SA: (non) Seasonally Adjusted * PMI: "Purchasing Managers Index" |
|||||


