There's typically very little to say that hasn't already been said come NFP morning. Although that's certainly true today, yesterday's weird price action suggests we hold the notion up to the fire--essentially asking: is there STILL very little that hasn't already been said? No. The title probably gave that one away, but here's why:
Literally and figuratively, bond markets moved into new range after 5/22, and handily confirmed the move on 5/29. Figuratively, the new range was (and is) the new way in which markets began thinking about "what might happen to interest rates" if the Fed adjusts the pace of asset purchases sooner than later.
The figurative move was given literal credibility by 10yr yields moving up over 2.07 on May 28th (that really really awful sell-off on the Tuesday back from Memorial Day). The short version of the thesis is that yesterday's swings didn't challenge any of the trends that we've been discussing since May 28th. For the MBS Commentary connoisseurs, here's the longer version, beginning with the 'morning after' post on May 29th (even if you don't make it all the way through this one on the busy morning, don't miss the before and after MBS charts at the bottom!).
From May 29th Day Ahead:
"The Jobs report on May 3rd was a wake up call for a bullish trend in yields that was--at the time--offsides with respect to longer term trends. It's not unreasonable to think that part of the fervor with which bond markets have weakened, is attributable, in part, to the pendulum swinging back from that extreme. This offsides position is seen in the chart below in the teal circle. A rush to neutrality would be the move into the red circle while the white circle is open to interpretation depending on how the upcoming few sessions pan out. It could end up being the same sort of "offsides" move that we saw in the teal circle."

I went on to give two nastier potential outcomes, but we got the first one. The white circle was indeed "offsides" and yields failed to confirm a break out of the range. Charts from the following day have been well-behaved as well. Taken together with what we saw yesterday, they confirm the 'nothing's changed' thesis.
From May 30th Day Ahead:

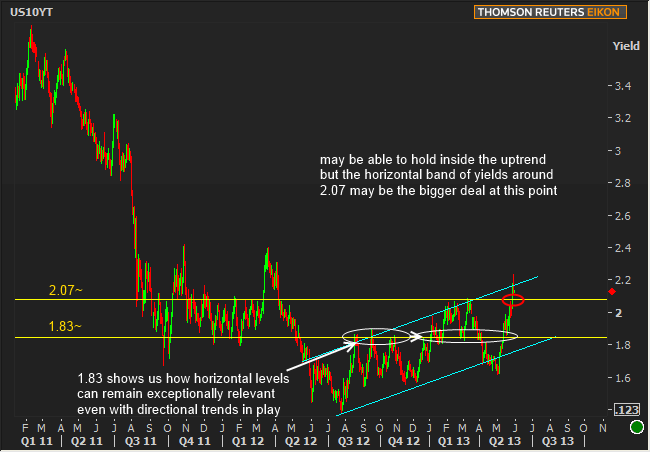
The captions on that chart speak for themselves. Indeed we did hold inside the teal line and indeed 2.07 has proven to be the bigger deal. As that became increasingly evident (the "pre-NFP range" set up by the upwardly trending teal line and 2.07 horizontally), I zoomed us in to a shorter term uptrend from May 3rd that sticks out rather sore-thumbishly :
From June 6th Day Ahead:
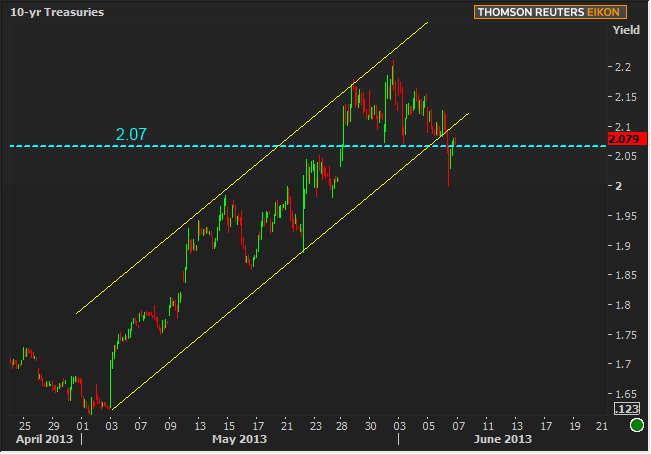
"Even if today's data manages to break the recent range, it would be like bending a tree branch in either direction, but not being able to break it. Speaking of tree branches, Treasuries have finally made a meaningful gesture to move outside May's uptrend in yield, but the more significant barrier remains the 2.04-2.07 gap. In that sense, 10's maybe be "going out on a limb" in the chart below (if this breaks today, it would still need to "stay broken" on Friday to confirm a break from a technical perspective)"

By the end of the day, the tree branch did not stay broken. Even if it had, we'd still be waiting on today's NFP to confirm the break (implication: nothing's changed).

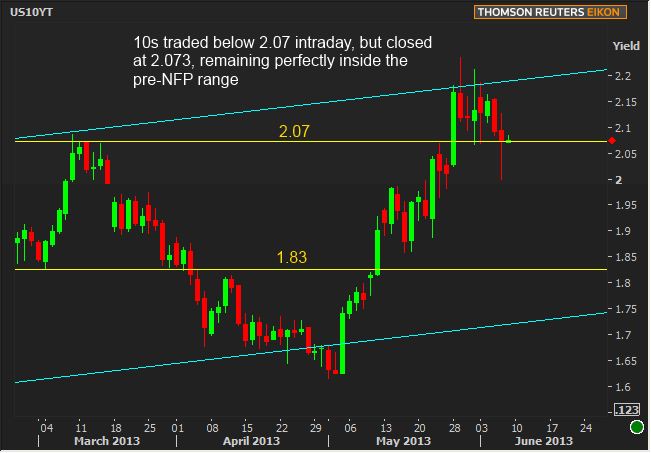
And this was the effect on the longer term trend seen in the May 30th chart above, updated below to include the movement between then and now:

If that's not enough to suggest that "nothing's changed" after yesterday's zoomy day, let's now consider the MBS chart from the same May 30th commentary:
From May 30th Day Ahead:
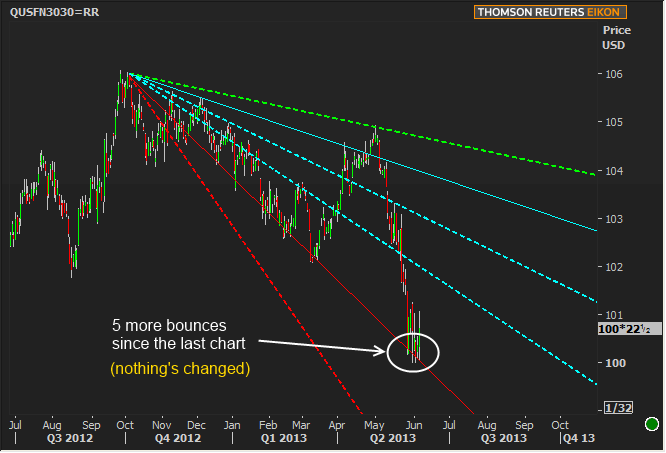
"The important line is the 2nd red one from the bottom (with all the white arrows). We'd have to sell-off to around 100-00 in Fannie 3.0s before revisiting the base speedline, so anything other than a horrible sell-off keeps the support intact."

Here's how that one panned out as of yesterday's close:

I rest my case. Bring on NFP.
|
Week Of Mon, Jun 3 2013 - Fri, Jun 7 2013 |
|||||
|
Time |
Event |
Period |
Unit |
Forecast |
Prior |
|
Mon, Jun 3 |
|||||
|
08:58 |
Markit Manufacturing PMI |
May |
-- |
-- |
51.9 |
|
10:00 |
Construction spending |
Apr |
% |
1.0 |
-1.7 |
|
10:00 |
ISM Manufacturing |
May |
-- |
50.5 |
50.7 |
|
Tue, Jun 4 |
|||||
|
08:30 |
International Trade |
Apr |
bl |
-41.0 |
-38.8 |
|
Wed, Jun 5 |
|||||
|
07:00 |
MBA Mortgage market index |
w/e |
-- |
-- |
721.4 |
|
08:15 |
ADP National Employment |
May |
k |
160 |
119 |
|
08:30 |
Productivity Revised |
Q1 |
% |
0.7 |
0.7 |
|
08:30 |
Labor costs Revised |
Q1 |
% |
0.5 |
0.5 |
|
10:00 |
ISM N-Mfg PMI |
May |
-- |
53.3 |
53.1 |
|
10:00 |
ISM N-Mfg Bus Act |
May |
-- |
55.0 |
55.0 |
|
10:00 |
Factory orders mm |
Apr |
% |
1.5 |
-4.9 |
|
Thu, Jun 6 |
|||||
|
08:30 |
Initial Jobless Claims |
w/e |
k |
345 |
354 |
|
Fri, Jun 7 |
|||||
|
08:30 |
Non-Farm Payrolls |
May |
k |
160 |
165 |
|
08:30 |
Unemployment rate mm |
May |
% |
7.5 |
7.5 |
|
08:30 |
Average workweek hrs |
May |
hr |
34.5 |
34.4 |
|
08:30 |
Average earnings mm |
May |
% |
0.2 |
0.2 |
|
15:00 |
Consumer credit |
Apr |
bl |
12.50 |
7.97 |
|
* mm: monthly | yy: annual | qq: quarterly | "w/e" in "period" column indicates a weekly report * Q1: First Quarter | Adv: Advance Release | Pre: Preliminary Release | Fin: Final Release * (n)SA: (non) Seasonally Adjusted * PMI: "Purchasing Managers Index" |
|||||


