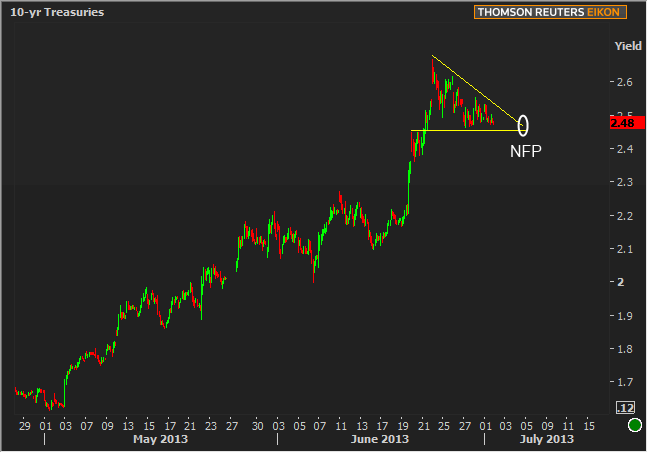
After a docile session on Monday, Tuesday offers up even less by way of economic data though might make up for some of the calendar shortcomings with slightly fewer vacation-related absences dragging volume down. Then again, given how low Monday's volume was, perhaps we should stop looking at the 'one day at the end of the week' as the ideal vacation day and focus more on the first 2-3. Today would certainly be a no-brainer and bond markets are certainly bowling with with the bumpers up until further notice (at least until Wednesday's data, but possibly even until NFP itself).

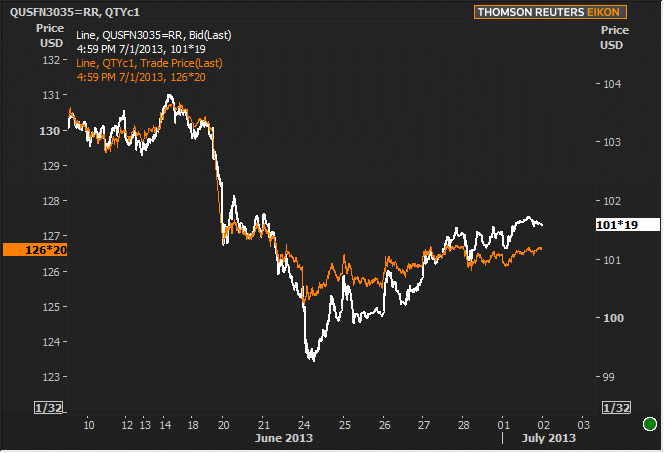
A lot can happen between now and the "white dot" in the chart above, but as long as it continues 'not happening,' MBS continue breathing into their paper bag, restoring some semblance of composure and perhaps even enjoying themselves into and through month-end. The following chart lines up prices of Treasury futures and Fannie 3.5 prices based on early June's relative flatness. Then the hilarity ensues as mortgages melt down and firm up after the FOMC Announcement.

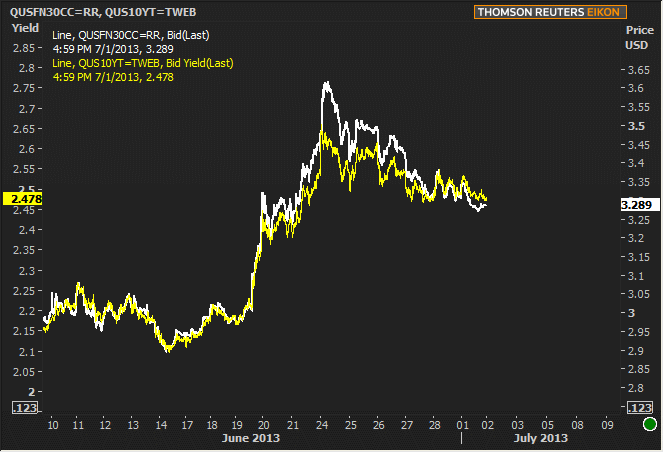
Judging by the chart above, MBS have been on a relative tear, but keep in mind that it's only showing price movement in one coupon in a market where duration expectations are rapidly changing, thus affecting the actual value of MBS a bit differently. When we adjust for duration expectations and express MBS in terms of yield compared to regular old 10yr Treasury yields, here's the result (In this case notice that MBS looks more like it's simply returning back to earth after attempting lift-off in late June):

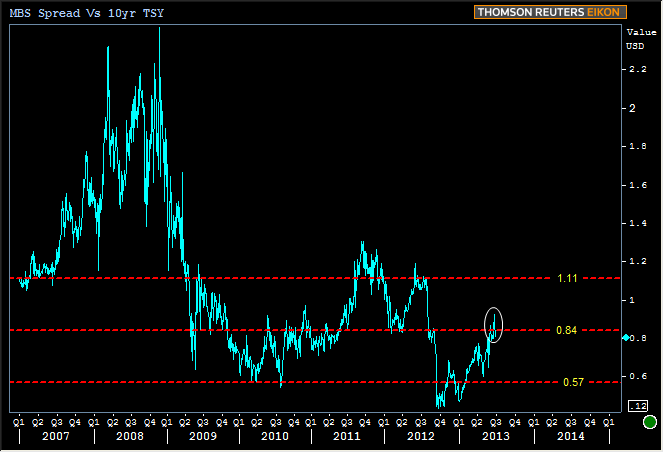
In truth, that was no moon jump, however. For an idea of just how insignificant these movements are from the Fed's point of view, here's a long term chart of the relationship between MBS yield (current coupon) and 10yr yield. Everything in the two charts above takes place in the space of the white oval in the chart below.

|
Week Of Mon, Jul 1 2013 - Fri, Jul 5 2013 |
|||||
|
Time |
Event |
Period |
Unit |
Forecast |
Prior |
|
Mon, Jul 1 |
|||||
|
08:58 |
Markit Manufacturing PMI |
Jun |
-- |
-- |
52.2 |
|
10:00 |
Construction spending |
May |
% |
0.7 |
0.4 |
|
10:00 |
ISM Manufacturing PMI |
Jun |
-- |
50.5 |
49.0 |
|
Tue, Jul 2 |
|||||
|
10:00 |
Factory orders mm |
May |
% |
2.0 |
1.0 |
|
Wed, Jul 3 |
|||||
|
07:00 |
MBA Mortgage market index |
w/e |
-- |
-- |
629.2 |
|
07:30 |
Challenger layoffs |
Jun |
k |
-- |
36.398 |
|
08:15 |
ADP National Employment |
Jun |
k |
153 |
135 |
|
08:30 |
Initial Jobless Claims |
w/e |
k |
345 |
346 |
|
08:30 |
International trade mm $ |
May |
bl |
-40.0 |
-40.3 |
|
10:00 |
ISM N-Mfg PMI |
Jun |
-- |
54.0 |
53.7 |
|
Thu, Jul 4 |
|||||
|
-- |
Markets Closed for Independence Day |
-- |
-- |
-- |
-- |
|
Fri, Jul 5 |
|||||
|
08:30 |
Non-farm payrolls |
Jun |
k |
167 |
175 |
|
08:30 |
Unemployment rate mm |
Jun |
% |
7.5 |
7.6 |
|
08:30 |
Private Payrolls |
Jun |
k |
180 |
178 |
|
08:30 |
Average workweek hrs |
Jun |
hr |
34.5 |
34.5 |
|
08:30 |
Average earnings mm |
Jun |
% |
0.2 |
0.0 |
|
* mm: monthly | yy: annual | qq: quarterly | "w/e" in "period" column indicates a weekly report * Q1: First Quarter | Adv: Advance Release | Pre: Preliminary Release | Fin: Final Release * (n)SA: (non) Seasonally Adjusted * PMI: "Purchasing Managers Index" |
|||||


