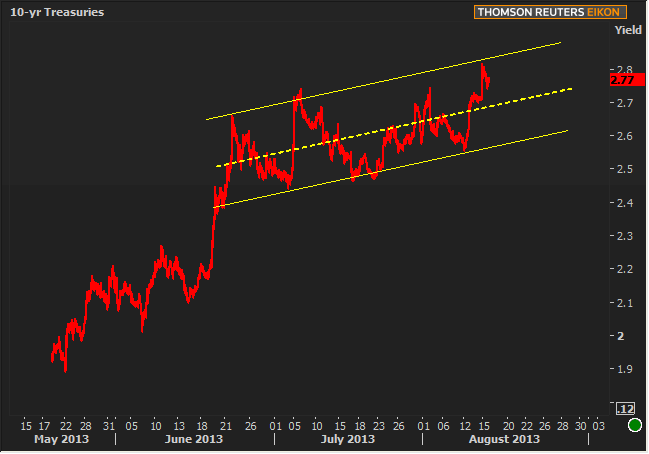
Yesterday's post was generally a warning against viewing 2.74 as a 'ceiling' in 10yr yields (read it here). That gives us the opportunity to discuss the counterpoint today. Yesterday's high volume bounce just over 2.8 was high enough that we now have a fathomable trend channel to consider. While this won't protect us from rottenly bullish economic data this morning, it would provide a nice bouncy ceiling for yields, should the data come in weaker-than-expected. The counterpoint to the counterpoint is that none of today's data delves very deep into the "employment" arena, and is thus potentially not as potent as yesterday's. STILL! Ranges are ranges until they're not any more, and this one--as ugly as it is--is starting to take shape. If we can get a solid bounce here, at least we know where the map points next.

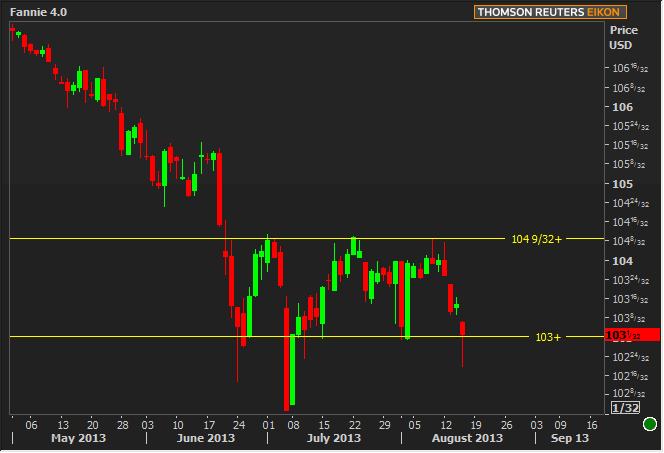
The obligatory MBS chart is still more horizontal, but no less meaningful. Thus far, 103-00 has been defended in all but the most dire of situations (the break is the July 5th NFP report). This doesn't mean it will continue to hold, but like the Treasury chart above, if we manage to bounce, a visit to the other side of the trend channel is implied.

|
Week Of Mon, Aug 12 2013 - Fri, Aug 16 2013 |
|||||
|
Time |
Event |
Period |
Unit |
Forecast |
Prior |
|
Mon, Aug 12 |
|||||
|
14:00 |
Federal budget, $ |
Jul |
bl |
-96.0 |
116.5 |
|
Tue, Aug 13 |
|||||
|
08:30 |
Import prices mm |
Jul |
% |
0.8 |
-0.2 |
|
08:30 |
Retail sales ex-autos mm |
Jul |
% |
0.4 |
0.0 |
|
08:30 |
Retail sales mm |
Jul |
% |
0.3 |
0.4 |
|
08:30 |
Export prices mm |
Jul |
% |
0.2 |
-0.1 |
|
10:00 |
Business inventories mm |
Jun |
% |
0.3 |
0.1 |
|
Wed, Aug 14 |
|||||
|
07:00 |
MBA Mortgage market index |
w/e |
-- |
-- |
495.4 |
|
08:30 |
Producer prices mm |
Jul |
% |
0.3 |
0.8 |
|
08:30 |
Producer prices, core mm |
Jul |
% |
0.2 |
0.2 |
|
Thu, Aug 15 |
|||||
|
08:30 |
Core CPI mm, sa |
Jul |
% |
0.2 |
0.2 |
|
08:30 |
Initial Jobless Claims |
w/e |
k |
335 |
333 |
|
08:30 |
NY Fed manufacturing |
Aug |
-- |
10.00 |
9.46 |
|
09:15 |
Industrial output mm |
Jul |
% |
0.3 |
0.3 |
|
09:15 |
Capacity utilization mm |
Jul |
% |
78.0 |
77.8 |
|
10:00 |
Philly Fed Business Index |
Aug |
-- |
15.0 |
19.8 |
|
10:00 |
NAHB housing market indx |
Aug |
-- |
57 |
57 |
|
Fri, Aug 16 |
|||||
|
08:30 |
Housing starts number mm |
Jul |
ml |
0.910 |
0.836 |
|
08:30 |
Labor costs Revised |
Q2 |
% |
1.0 |
-4.3 |
|
08:30 |
Building permits: number |
Jul |
ml |
0.935 |
0.918 |
|
08:30 |
Productivity Revised |
Q2 |
% |
0.6 |
0.5 |
|
09:55 |
U.Mich sentiment |
Aug |
-- |
85.5 |
85.1 |
|
* mm: monthly | yy: annual | qq: quarterly | "w/e" in "period" column indicates a weekly report * Q1: First Quarter | Adv: Advance Release | Pre: Preliminary Release | Fin: Final Release * (n)SA: (non) Seasonally Adjusted * PMI: "Purchasing Managers Index" |
|||||


