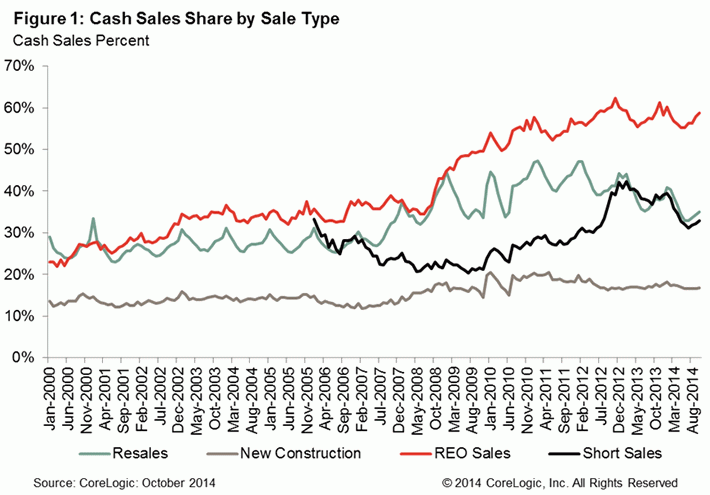
Cash sales dropped on a year-over-year basis for the 22nd consecutive month in October and CoreLogic is projecting they will return to their pre-crisis levels by 2017. All-cash transactions represented a slightly higher share of transactions in October than in September, 35.5 percent versus 35.0 percent, but the company said the relative share of those sales typically rises during the fall and winter months. They suggest that year-over-year comparisons are more indicative of trends.
And that trend is undeniably down. Compared to October 2013 cash sales have retreated by over 3 percentage points. In October 2013 they made up 38.7 percent of home sales. The peak for cash sales came in January 2011 at 46.4 percent. After beginning a steady decline in January 2013 cash sales are on track to return to their pre-crisis level of around 25 percent by 2017.
The share of all cash sales was by far the highest for lender owned (REO) property at 58.7 percent. REO however now accounts for such a minimal percentage of home sales (7.8 percent in October) it has little impact on overall cash sales figures. In January 2011, when the cash sales share was at its peak, REO sales made up 23.9 percent of total sales. Thirty-five percent of re-sales (existing homes) were cash transactions, 33 percent of short sales, and 16.8 percent of newly constructed homes.

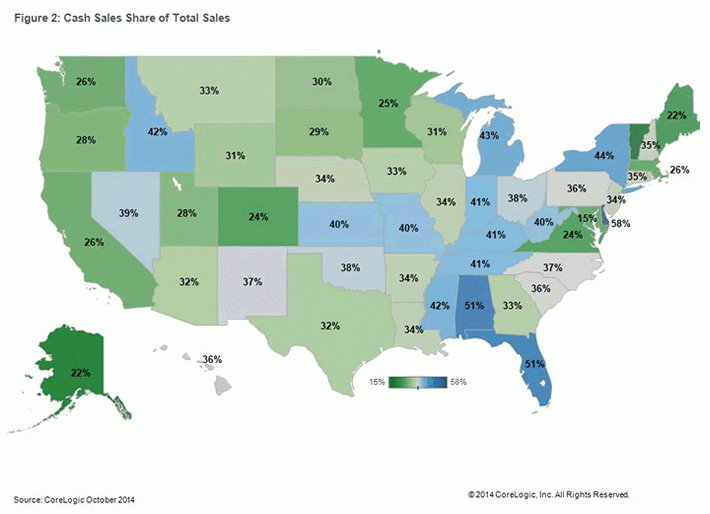
Delaware had the largest share of cash sales at 58.3 percent, followed by Alabama (51.3 percent), Florida (51.1 percent), New York (44.4 percent) and Michigan (43.1 percent). The Miami metropolitan areas topped the list of the nation's largest 100 Core Based Statistical Areas (CBSAs) measured by population at 56.6 percent, followed closely by the West Palm Beach-Boca Raton area at 56.1 percent. Fort Lauderdale, Detroit and Cape Coral-Fort Myers all had cash sales in the 55-56 percent range.


