Nearly 80 percent of America's housing stock is at least 20 years old and twice that share of homes were built 50 or more years ago. With new construction still well behind its pre-recession levels Americans have been remodeling these older homes in huge numbers.
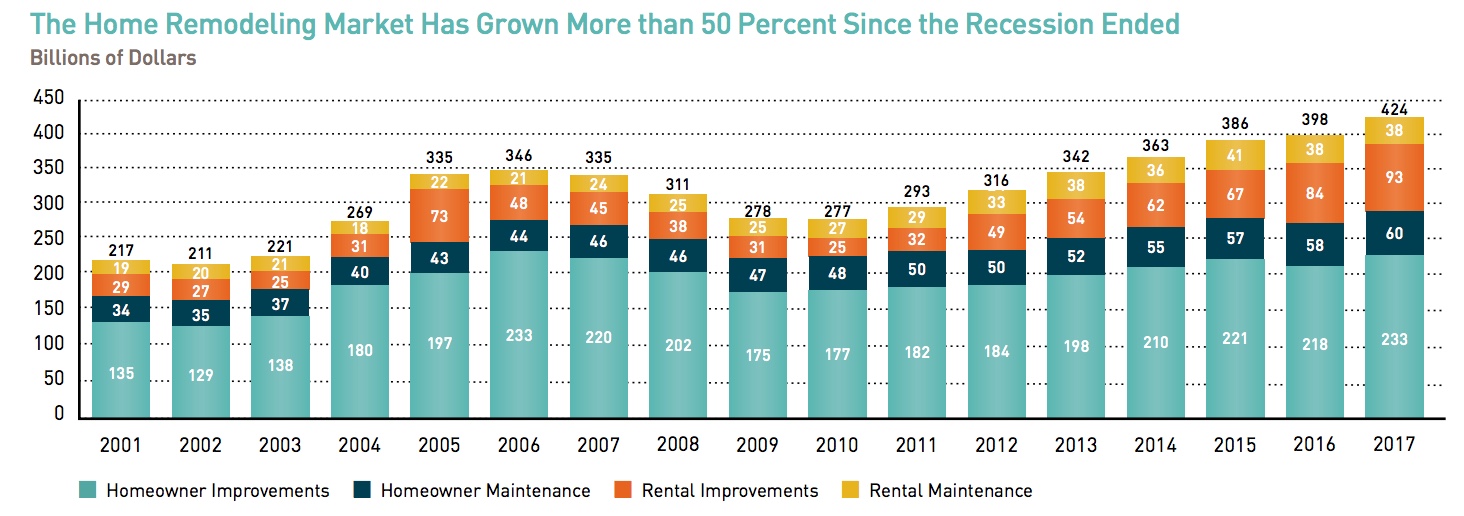
The Joint Center on Housing Studies says there was $425 billion spent nationally on maintenance and improvement, a 10 percent increase from 2015 and more than a 50 percent gain from the 2010 low. In fact, that spending, by both owner occupants and landlords, has been the dominant share of residential investment in the years since the recession and generated 2.2 percent of total economic activity in 2017.

Spending for improvements on rental properties are a larger share of spending than the historic average of 25 percent. A surge in renting during the Great Recession drove a boom in multifamily construction, but rising construction costs put rents on new units out of reach for many so owners of existing rentals invested in significant upgrades to their properties to capture some of this demand, driving the rental share of residential improvement from about 20 percent in 2007 to over 30 percent in 2016 and 2017.
The foreclosure crisis left many homes vacant for extended periods and there was also widespread conversion of owner-occupied housing to rentals. As homeownership demand started to recover, the number of vacant or rental homes moving back into owner occupancy has grown, increasing from 5.0 million in 2010 and 2011 to more than 6.6 million in 2016 and 2017. With home construction lagging homebuying demand, these units make up a growing part of the owner-occupied stock.
Spending by owners of these newly converted homes increased from $33 billion in 2010-2011 to $50 billion in 2016-2017, while average per owner spending rose from $6,500 to $7,500. Owners spent more than double on homes that had been vacant than where they had been rented ($10,400 versus $4,500) Spending on homes that remained owner occupied averaged only $5,500. Spending for kitchen and bath remodels and room additions were especially high among the conversions.
Improvements to owner-occupied homes accounted for 55 percent of total expenditures in 2017. The Joint Center analyzed data from the most recent American Housing Survey (AHS) for its recent publication, Improving America's Housing 2019. It shows that 22 million US homeowners completed at least one home improvement project that year. These ranged from a relatively simple window or door replacement, to HVAC replacement, to a complete kitchen remodel or room addition.
Most projects were small; 40 percent reported spending less than $2,500 and three-quarters spent less than $10,000. Even so, owners spending $50,000 or more contributed one-third of the total $233 billion spent by homeowners in 2017 while those spending at least $25,000 accounted for more than half.
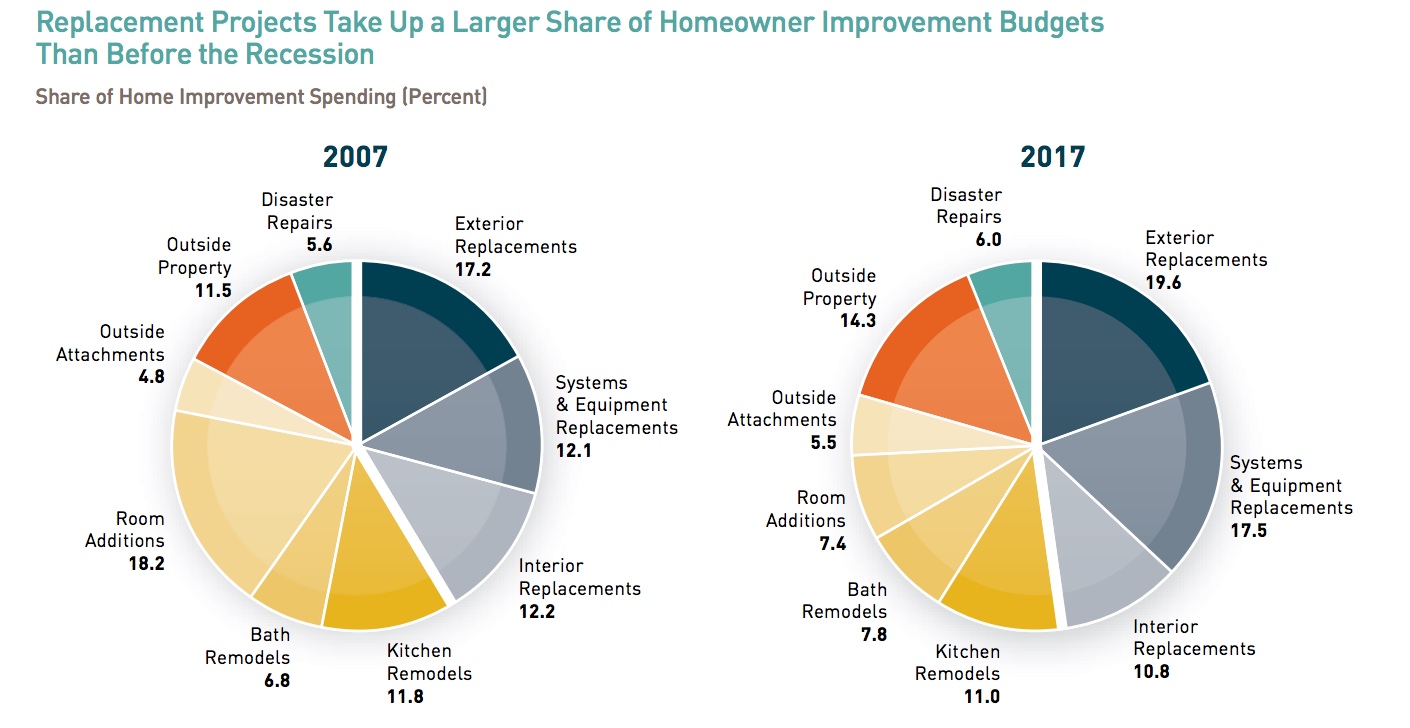
Spending on replacement projects has historically matched spending on discretionary fixes such as additions or bath remodels with about a 40 percent share. Since the recovery however the replacement share has grown to almost 50 percent. This increase in replacements and system upgrades probably reflects necessary work deferred during the recession as well as the aging of the housing stock. With lagging homebuilding, the median age of owner-occupied homes has grown from 29 years in 1997 to 39 in 2017.
Homeowners spent $68 billion or 29 percent of the market total on improvements increase the energy efficiency of their homes; replacing roofing and windows, adding insulation. Over 17 percent of homeowners cited energy efficiency as the motivation for their projects, up from 11 percent in 2013. This was especially true in metros with older homes and harsh winters.

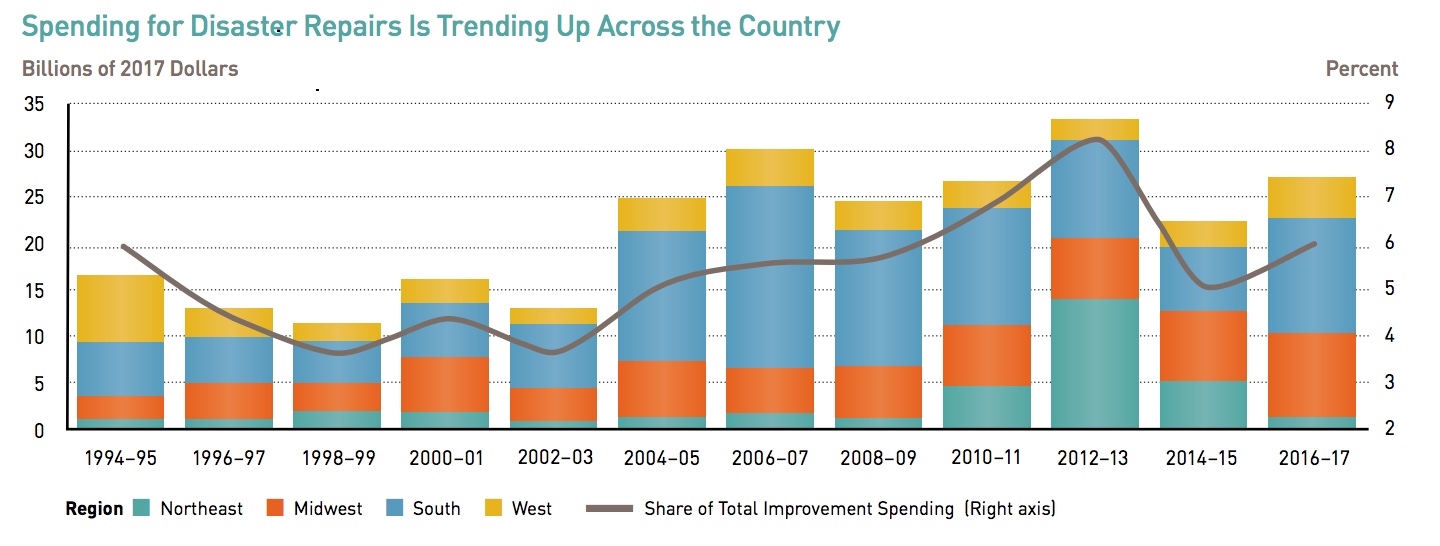
Spending on disaster recovery is also growing, both in absolute terms and as a share of expenditures. Outlays for disaster-related improvements exceeded $27 billion in 2016-2017, nearly double the two-year average of $14 billion two decades earlier. This spending growth has been especially strong in the South and Midwest. While insurance payouts covered most of disaster repair costs, homeowners paid out of pocket for more than four in ten projects in 2016-2017. Where there were insurance payouts owners spent $20,000 on average for restoration projects in 2016-2017, but just $12,000 if they paid for the repair of disaster damages on their own.

The share of spending on do-it-yourself (DIY) projects, which includes only the material costs, fell steadily from 25 percent in 1997 to just 18 percent in 2017. The aging of the US population explains at least part of this long-term decline. In 2017, 88 percent of improvement money spent by homeowners age 65 and over was for professionally installed projects compared with 69 percent by owners under age 35. The younger groups DIY share of outlays has also trended down, from 35 percent in 1995-2005 to 31 percent in 2017.
The increase in replacements also tilt spending away from DIY. Even talented DIYers are likely to hire professionals for electrical, plumbing, and roofing upgrades. Indeed, 86 percent of spending on replacement projects in 2017 was for professional installation, significantly more than the 76 percent share for discretionary projects.
Per-owner spending on home improvements in 2017 averaged $3,000 and half of all individual project spending was under $1,200. Households typically (77 percent) pay for these small projects out of pocket. The rest was paid for through credit or retail store charge cards (5 percent), home equity loans or lines of credit and cash from mortgage refinancing (5 percent), and insurance settlements (4 percent). Nine percent came from "other" sources such as contractor financing or personal loans.
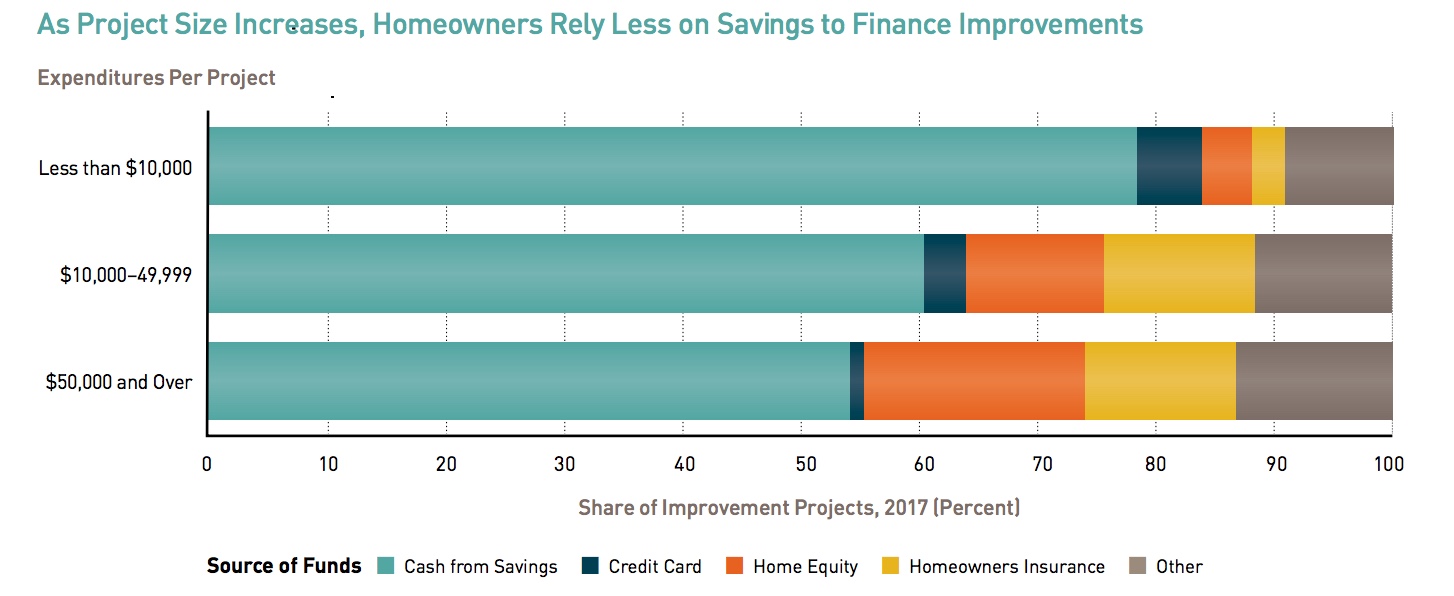
The share paid with cash steadily shrinks on larger projects, from 78 percent of projects under $10,000 to 60 percent for those costing $10,000 to $49,999, 54 percent for those costing $50,000 or more. Financing is more likely to come from home equity loans or cash out refinances as well as insurance settlements.

Financing varies as well by type of installation. Owners paid cash for 84 percent of DIY projects compared with 72 percent of work done by professional contractors. Landscaping, security systems and walkways/driveways are most likely to be paid out of pocket while roofing, siding, and additions are financed from other sources. The cost of a project tends to be higher where financing is used instead of savings.
The steady increase in home prices since 2011 has been good news for the remodeling market. Knowing that their homes are increasing in value incentivizes owners to invest in them, and the growing equity can provide the funds to do so. This relationship is clear at the metropolitan area level. In metros with strong home price growth in the last decade, areas like Boston, Dallas, San Antonio, San Jose, San Francisco, and Seattle, owners have typically spent substantially more on home improvements than owners in metros where prices have not yet fully recovered like Las Vegas, Miami, Phoenix, and Riverside.
However, there are limits to this relationship. Home prices have outpaced income growth for several years and when coupled with rising mortgage interest rates are making homeownership increasingly unaffordable especially to many younger households-the demographic most critical to long-term growth of the home remodeling market.
Other factors may mitigate against the remodeling market as well. Mobility, the rate at which the population changes residences each year, has declined by almost half over the past four decades and homeowners typically spend 25-30 percent more on remodeling projects in the first few years after relocating than do those who stay put. This slowdown is due in part to the aging of the population, the decline in household size, and advances in technology that have made telecommuting an alternative to relocation.
Another potential problem is the depressed homeownership rate among younger households. Homeowners under age 35 have accounted for only 8-9 percent of home improvement spending annually since 2012, about 5 percentage points less than their average share over the 1995-2011 period. An exception is areas where homeownership is relatively affordable. There younger households do contribute significantly to home improvement spending.
While homeowners aged 35-54 have the highest per capita spending on home improvement, their share of market spending has declined from more than 50 percent in 1995-2005 to just 41 percent in 2015 with the leading role taken by homeowners over age 55. Their numbers have grown from 26 million to more than 42 million between 1997 and 2017 and their share of all homeowners increased from 40 to almost 55 percent.
These older homeowners are living longer and are willing and able to spend on improvements that allow them to remain safely in their homes as they age. Their average spending increased by 57 percent during that period, to nearly $2,800. In aggregate these changes have increased spending among older owners by 150 percent to $117 billion. By comparison, total market spending was up just 9 percent among owners under age 35 and 12 percent among owners aged 35-54 over this period.
The growth in spending by those over age 65 was especially strong, up nearly 80 percent to $2,500 in the 20 years. Spending by those aged 55 to 65 increased 33 percent while spending among those 35-54 was only 20 percent higher after 20 years.
Older homeowners tend to devote a larger share of their improvement dollars (51 percent) to replacing home components and systems than younger homeowners (43 percent) and are increasingly focused on making their homes more accessible. More than 72 percent of those over 55 reported undertaking at least one project to improve accessibility for the elderly or disabled. These are likely to be more expensive such as bathroom and kitchen remodels or room additions to allow single-floor living.
Older homeowners are dominating the market in part because of the low homeownership rate of younger households since the Great Recession. But the number of homeowners under age 35 did rise 6 percent to 7.3 million between 2015 and 2017. Improvement spending among this age group grew even faster, climbing 20 percent in real terms over this period to about $22 billion and average per owner improvement spending rebounded 38 percent from $2,100 to $2,900 between the 2013 low and 2017. Per owner spending among younger owners in 2017 nearly matched the prior peak of $3,000 in 2007. In part this is because younger homeowners have higher incomes than those than the older cohort who were more impacted by the Great Recession.
What does the report see for the future? The Joint Center says household growth alone should lift the number of homeowners over the next two decades. But as more lower- and middle-income households move into homeownership the recent jump in per owner improvement spending among the youngest cohort is likely to slow to a more sustainable pace. Still, the expected growth in their sheer numbers should more than offset slower spending and keep expenditures on the rise. Nonetheless, the report says, the ability of younger households to make the transition to homeownership is ultimately the key to the remodeling market outlook.
The growing number of older homeowners coupled with older homes that are not configured for accessibility will continue to drive aging-in-place accommodative spending. This will be especially true in slower-growing areas of the Northeast and Midwest where building of new homes, more likely to have accessibility features, is more constrained.
The share of replacement projects is likely to remain high as the housing stock ages and the number of older homeowners grows. Since these are projects generally requiring professional installation, the DIY share of spending is expected to remain relatively low.
Low energy costs of late has reduced the payback from those types of upgrades. If prices remain subdued the motivation to undertake further energy retrofits may also be limited.
At the same time, disaster recovery spending is likely to climb. The Joint Center says recovery from an event is usually spread over two or three years so there may already be a backlog of work from the 2016-2018 spate of hurricanes and wildfires. If the trend of stronger and more frequent events continues, so will related expenditures increase.
Financing home improvement is a promising growth opportunity. Heavy reliance on savings limits homeowners' options. Expanding the types and availability of new financing alternatives-especially those tied to home equity- would likely lead to more growth in remodeling while helping to preserve and modernize the nation's housing stock.


