Home prices nationwide have now recovered to within 13.5 percent of the peak they reached in June 2006. The national Home Price Index (HPI) provided by Black Knight Financial Services' Data and Analytics Division is $233,000, inching closer to the $270,000 HPI that was the pre-crisis peak. This presents an increase of 7.6 percent from an HPI of $217,000 in March 2014 and a 0.7 percent increase from February.
Some areas, notably the States of Texas and Colorado and some of the larger cities in Texas, surpassed their 2006 price levels last summer and the Texas locations have continued to post new peak HPI levels virtually every month since. Texas established a new record level again in February at $188,000 and Colorado after dropping back for a few months also set a new high of $259,000. Other locations lag far behind the national averages. Florida, for example, is still more than 33 percent below its peak, Arizona is down over 31 percent and Illinois lags by a quarter and California by 23.4 percent.
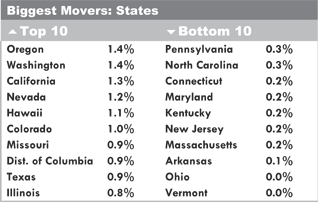
Ten states had increases in their HPI's greater than that 0.7 national monthly average. Oregon and Washington posted monthly gains of 1.4 percent followed by California Nevada, and Hawaii at 1.3, 1.2, and 1.1 percent respectively. Other states with larger averages were Colorado, Missouri, the District of Columbia, Texas, and Illinois. The smallest improvements were in Ohio and Vermont which were unchanged from February, Arkansas, up 0.1 percent, and Connecticut, Maryland, Kentucky, New Jersey, and Massachusetts each of which had a 0.2 percent increase in their respective HPIs.

Eight of the ten most improved metropolitan areas were in California with San Jose and San Francisco leading at 2.6 percent and 2.2 percent gains respectively. Other cities with improvements ranging from 1.4 to 1.8 percent were Santa Rosa, Vallejo, Modesto, Stockton, and San Louis Obispo and Oxnard. Seattle and Portland, Oregon also broke through with monthly increases of 1.7 and 1.5 percent. While Austin, Dallas, and Houston had smaller monthly gains than other cities (each increased by 0.9 percent) all three established new peak prices during the month.
The Black Knight HPI combines the company's property and loan-level databases to produce a repeat sales analysis of home prices as of their transaction dates every month for each of more than 18,500 U.S. ZIP codes. The Black Knight HPI represents the price of non-distressed sales by taking into account price discounts for REO and short sales.


