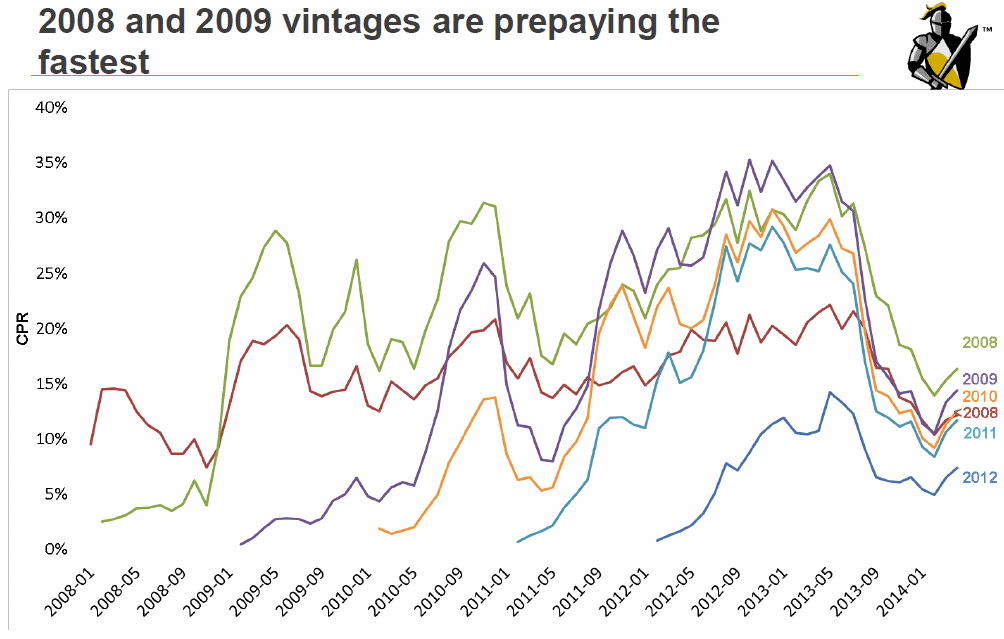
Prepayment rates, an indicator of refinancing activity, increased slightly in April, the second consecutive monthly increase, as interest rates declined Black Knight Financial Services said today. Those rates, which had neared 2 percent of outstanding mortgages in late 2012 and early 2013 as interest rates achieved record lows of less than 3.5 percent, fell through mid-to-late 2013 as rates rose more than a point. With the recent pull-back in interest rates prepayments have risen, reaching .87 percent in April.

Black Knight's Mortgage Monitor reports that the bump in prepayment activity held across all post-recession vintages of loans, but loans originated in 2008 and 2009 were prepaying the fastest in April. The uptick also occurred for loans despite their combined loan-to-value ratios (CLTV) but those with CLTVs under 100 percent increased by over one third between February and April while refinancing for loans with the highest CLTV's went up by about 20 percent.
Prepayment rates for adjustable rate mortgages (ARMS) were generally higher than those for fixed-rate mortgages (FRMs) except in the highest rate bucket (6-6.5 percent). Black Knight said this suggests that concerns about rising interest rates persist among the borrower population, despite the recent pullback in 30-year conforming rates. Prepayments for ARMs were highest among those with interest rates under 6 percent with loans in the 5-5.5 percent bucket prepaying the fastest.
Significant numbers of households hold mortgages that are refinancible and the numbers that are priced out because their current interest rate makes refinancing unfeasible has stabilized since the first of the year along with rates. Black Knight estimates that there are about 5.1 million refinancible mortgages in the U.S.
Mortgage originations increased 18 percent in March with refinancing rising 13 percent from the previous month while purchase originations were up 21 percent. Purchase mortgages represented 67 percent of originations in the first quarter of the year compared to 27 percent in the first quarter of 2013.
Loans that have refinanced in recent years through the Home Affordable Refinance Program (HARP) which was designed to assist borrowers otherwise unable to refinance because of high LTVs are reported by Black Knight to be performing better than loans originated during the same period to purchase homes. The 60 day delinquency rate for HARP loans with LTVs greater than 100 percent had a higher delinquency rate in each time period than those with LTVs below that figure and both had higher delinquency rates than conventional refinancing but both types of HARP loans had delinquency rates well below loans originated for home purchase until 2013. While those loans have only a brief history, the higher LTV HARP loans are running a 60 day delinquency rate that is double that of purchase loans.
Black Knight notes that negative equity is a major driver of loan defaults with delinquency rates rising in lockstep with the degree the property is underwater. The percentage of underwater homes has steadily decreased as home prices have risen but Black Knight points out, negative equity now presents a new concern. As of April, there were approximately 2 million modified mortgages facing interest rate resets and more than 40 percent of those loan modifications are currently underwater.
"We have seen a continual reduction in the number of underwater borrowers
at the national level for some time now, but modified loans show a different
picture," said Kostya Gradushy, Black Knight's manager of Loan Data and
Customer Analytics. "While the national negative equity rate as of April
stands at 9.4 percent of active mortgages, the share of underwater modified
loans facing interest rate resets is much higher -- over 40 percent. In
addition, another 18 percent of modified borrowers have 9 percent equity or
less in their homes. Given that the data has shown quite clearly that equity --
or the lack thereof -- is one of the primary drivers of mortgage defaults,
these resets may indeed pose an increased risk in the years ahead.
"From a broader perspective, it's also important to note that more than
one of every 10 borrowers is in a 'near negative equity' position, meaning the
borrower has less than 10 percent equity in his or her home. This is
particularly pronounced in New Mexico and Southern states. At a local level --
and we look at both mortgage performance and Home Price Index (HPI) data down
to ZIP code granularity -- such slim margins in equity can have a significant
effect on overall negative equity levels with even slight variations in HPI.
So, while the overall situation for underwater borrowers has improved
significantly, there are still areas in the country where borrowers are
hovering at the edges."
Finally, as foreclosure sales (completions) increased in both judicial and non-judicial states -- though the increase was larger in the former than the latter -- Black Knight observed the gap between judicial and non-judicial pipeline ratios (ratio of loans 90 or more days past due or in foreclosure to the current rate of foreclosure completions) had narrowed to its lowest point since at least 2005. The judicial states' pipeline ratio now stands at 52, as compared to its high of 118 months back in 2011. In contrast, the non-judicial states' pipeline ratio at that time was 33 months -- it has now increased to 48, its highest point on record.


