Four investor classes, foreign investors, the Federal Reserve, fixed income funds, and banks, have dominated the U.S. Treasury (UST) market in recent years. In a report today Bank of America/Merrill Lynch said it sees the future demand from each of the groups now turning negative for the five and ten year part of the Treasury curve, the area where these investors have been most active.
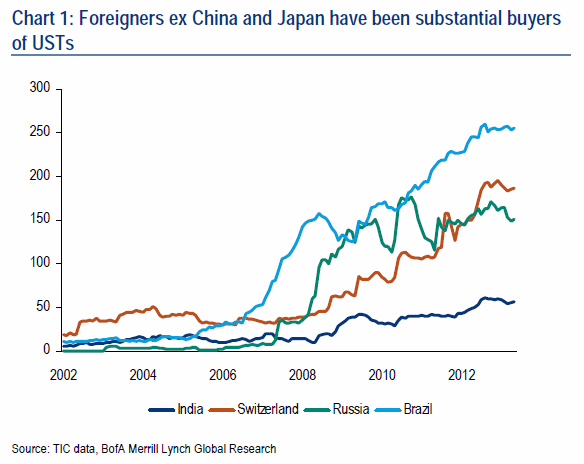
Foreign investors are the largest holders of U.S. Treasuries, with a near 50 percent share of outstanding debt holdings. In the last five years official foreign sources have more than doubled their holdings, from $1.5 trillion in 2005 to nearly $4.1 trillion today. By far the largest foreign holders are China and Japan but other countries holding substantial amounts of USTs are Brazil, India, Russia and Switzerland, Their combined holdings has tripled in the last five years. Portfolio inflows into these countries, fueled by the Fed's qualitative easing, has led to sizable reserve growth which has been channeled by reserve managers back into USTs.
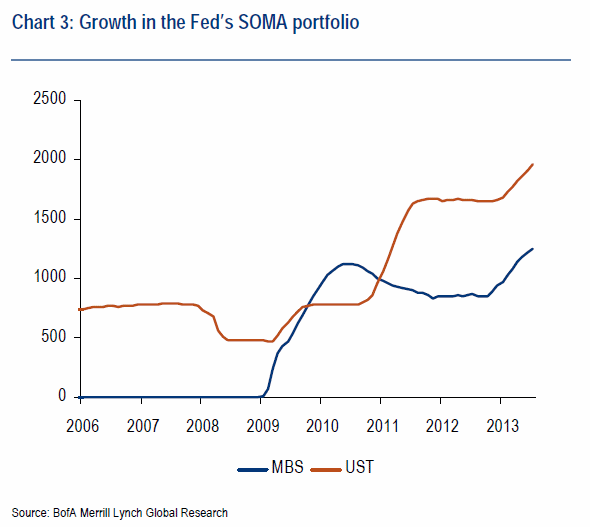
The most public source of demand for Treasuries since 2009 has been the Federal Reserve. Since it began the first round of quantitative easing its portfolio of Treasuries has grown by nearly $1.5 trillion and the average maturities of that portfolio, in part due to the 15 month life of Operation Twist, has increased from less than two years before the crisis began to ten years today.
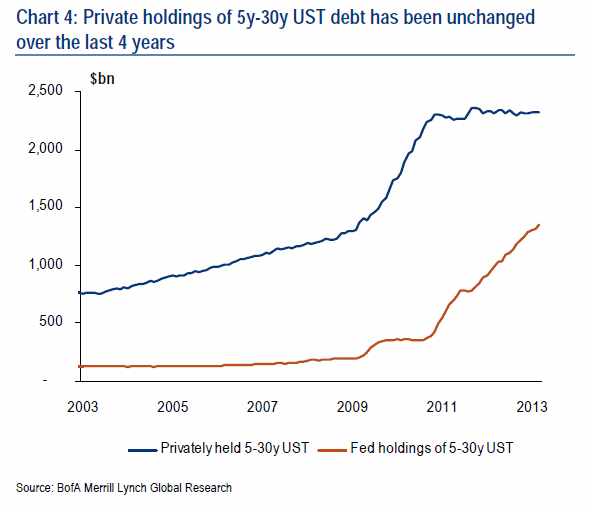
The impact of Fed purchases is evident from Chart 4 which shows the sky-rocketing share of 5 to 30 year UST debt by the Federal Reserve while the level of privately held debt has barely moved. The Fed's mortgage-backed securities (MBS) portfolio has also increased by $1.25 trillion since 2009.
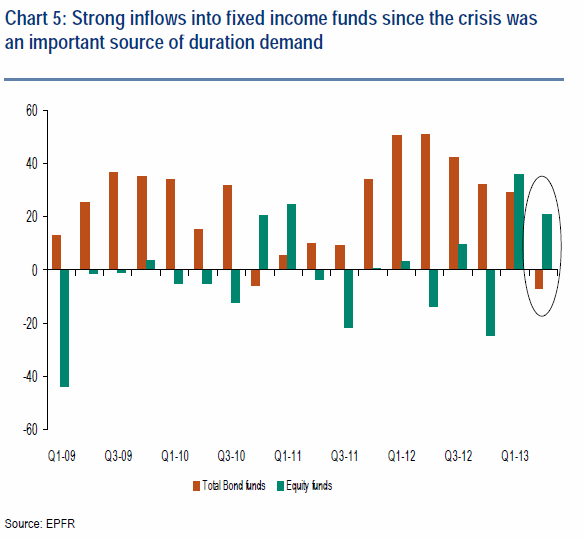
Fixed income funds have increased their Treasury holdings by $400 billion since 2009, while decreasing their share of equities. Inflows into Treasury-only funds have been small. Note that a sizable portion of flows into total return funds is likely to have flown into Treasuries given that they make up a substantial portion of the aggregate benchmark. Overall demand for high quality duration from these funds have helped keep yields and term premiums at historic lows.
As banks have changed the composition of their balance sheets since 2008, the growth on the asset side has been notably tilted toward growth in bank securities as compared with loans. Commercial banks hold $2.7 trillion in securities of which $1.8 trillion is in Treasury and agency securities; agency MBS holdings total $1.34 trillion and Treasury and agency debt securities total $460 trillion. This represents a portfolio growth of $500 billion since 2009 all in Treasury and agency securities.
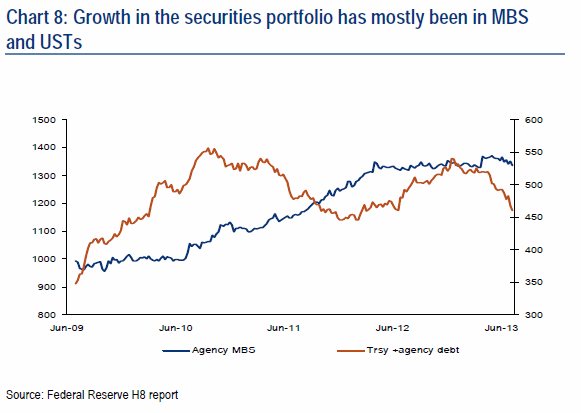
Under pre-Basel III guidelines bank regulatory capital ratios are protected from being impacted by mark to market losses on securities and this has led to banks increasing their holdings of low risk-weighted assets despite duration and spread risks. Declining rates and tightening spreads made a further case for owning these assets.
Bank of America says each of these four asset classes faces a changing outlook that may lessen their demand for Treasuries. For emerging market investors, higher interest rates in the U.S. Have triggered large outflows and led to substantial currency depreciation which in turn mean lower reserve growth and fewer dollars to be channeled toward Treasuries. In the case of countries such as Turkey, Indonesia, and India, active interventions on behalf of their currencies and the need to sell dollar reserves provide a further negative for demand as Treasuries would be the most liquid assets.
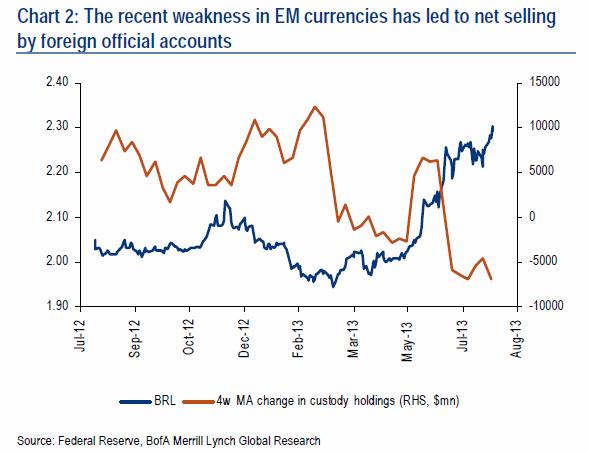
A stronger dollar and weakening safe have status of both JPY and CHF is likely to mean lesser intervention in these countries going forward. Interventions in Japan in 2010 and 2011 totaled $210 billion, much of which was channeled into USTs.
While the timing is still uncertain it is obvious that the Federal Reserve is nearing the end of its asset purchase program and will no longer be a large buyer of duration. This means the private market will have to absorb a substantial part of the duration supply. Given the durations around which the quantitative easing programs were centered the point of maximum impact of increased private duration is likely to be in the 5 to 10 year part of the curve.
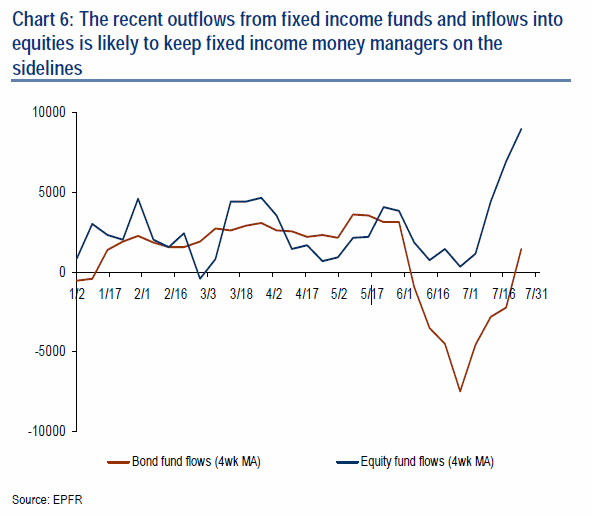
Possibly because of the weakness in fixed income performance in May, fixed income fund flows reversed in June and July to nearly $25 billion in outflows. The initial flow from fixed income into cash was not concerning as such moves are temporary but recent flows into equity funds are a concern. Equity funds have received nearly $40 billion over the last five weeks and further inflows into risky assets is likely to mean the start of a longer term trend.
The three largest U.S. Banks by assets reported a combined $10 billion loss in the second quarter almost entirely due to the rise in rates and spreads. Changing Basel II rules mean large banks have to include unrealized gains and losses on their AFS portfolios when calculating regulatory capital. Thus another bad quarter would be even worse under the new rules, not only hurting shareholder equity but also Tier 1 capital and leverage rations. In addition, the recovering economy could mean an increase in loan demand and thus a reluctance for banks to tie up assets in longer-term low-yielding fixed income assets


