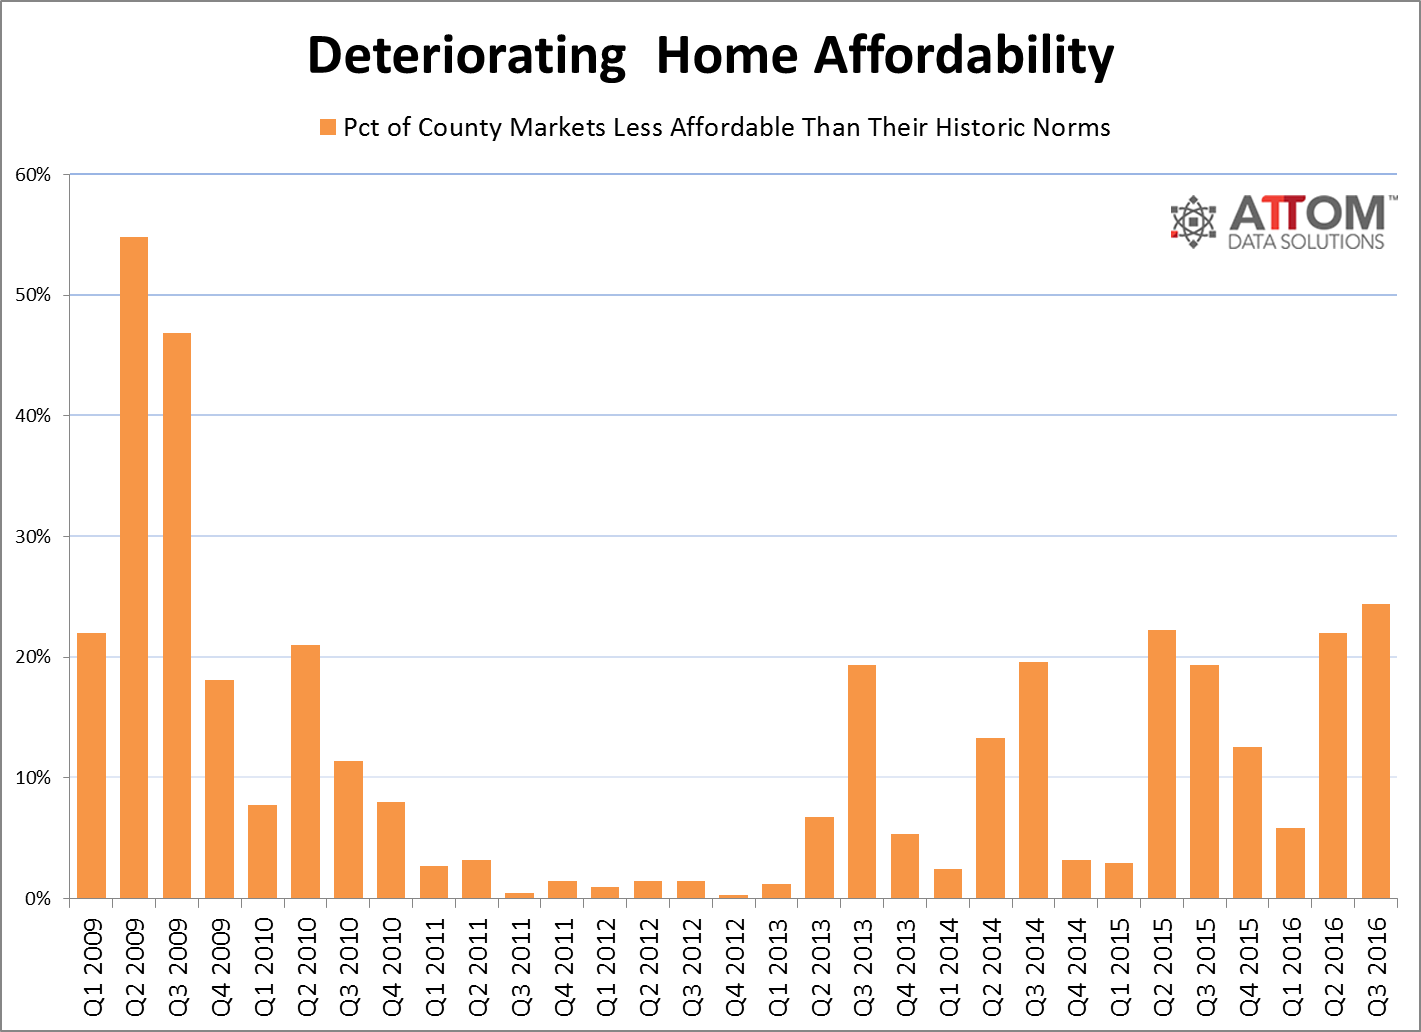
The lack of housing affordability is rising among the 414 U.S. counties tracked by ATTOM Data Solutions. ATTOM, the new parent company of RealtyTrac, said on Thursday that 24 percent of those counties were less affordable than their historic averages in the third quarter of 2016, up from 22 percent in the second quarter and 19 percent a year earlier. It was the highest share for this metric since the third quarter of 2009 when 47 percent of markets had fallen below their historic affordability averages.
ATTOM reports that 101 of the 414 counties had an affordability index below 100 in the third quarter of 2016, meaning that buying a median-priced home in that county was less affordable than the historic average for that county going back to the first quarter of 2005.
ATTOM's affordability index is based on the percentage of average wages (taken from the U.S. Bureau of Labor Statistics) that is needed to make monthly house payments on a median priced home (as determined from publicly recorded sales deeds.) That payment is composed of principle, interest on a 30-year fixed rate mortgage with a 3 percent downpayment and including property taxes, and insurance.
"The improving affordability trend we noted in our second quarter report reversed course in the third quarter as home price appreciation accelerated in the majority of markets and wage growth slowed in the majority of local markets as well as nationwide, where average weekly wages declined in the first quarter of this year following 13 consecutive quarters with year-over-year increases," said Daren Blomquist, senior vice president at ATTOM Data Solutions. "This unhealthy combination resulted in worsening affordability in 63 percent of markets despite mortgage rates that are down 45 basis points from a year ago.

Counties that were less affordable than their historic averages in Q3 included Harris County (Houston), Kings County (Brooklyn); Dallas County; Bexar County (San Antonio); and Alameda County in the San Francisco metro area.
Counties still affordable by historic standards included Los Angeles County, Cook County (Chicago); Maricopa County (Phoenix); Miami-Dade County; and Queens County, New York.
Affordability improved in 153 counties (37 percent) compared to a year ago, including in the bellwether high-priced markets of Marin County in the San Francisco Bay Area; Santa Clara County (San Jose); Kings County; Arlington County in the DC metro area and Maui County, Hawaii. Affordability in these areas improved between 1 and 5 percent.
"Some silver lining in this report is that affordability actually improved in some of the highest-priced markets that have been bastions of bad affordability, mostly the result of annual home price appreciation slowing to low single-digit percentages in those markets" Blomquist continued. "This is an indication that home prices are finally responding to affordability constraints - a modicum of good news for prospective buyers who have been priced out of those high-priced markets."
Affordability levels worsened in 261 counties (63 percent) compared to a year ago while annual growth in median home prices outpaced annual growth in average weekly wages 89 percent or 368 counties. That was a reversal from the trend in previous quarters, when the share of counties with home price growth outpacing wage growth dropped as low as 58 percent in Q2 2016.
Across the 414 counties, the average annual change in average weekly wages was -0.1 percent while the average annual change in median home sales prices was 7 percent. Since bottoming out in Q1 2012, median home prices nationwide have risen 60 percent while average weekly wages have risen 6 percent during that same time period.
Across all counties analyzed wage earners need to spend an average of 36.3 percent of their income to buy a median-priced home, still below the historic average of 38.8 percent but up from 35.9 percent in the second quarter and from 35.8 percent a year ago. Rising well above the national average were Kings County at 123.5 percent, Santa Cruz County (111.1 percent) Marin County (109.4 percent) New York County (Manhattan) (96.6 percent) and San Luis Obispo County, California (91.2 percent).
Counties that were most affordable by this absolute standard were Clayton County (Atlanta), (10.1 percent of average wages needed to buy a median-priced home); Rock Island County, Illinois (13.3 percent); Trumbull County (Youngstown) (15.2 percent); Saginaw County, Michigan (15.4 percent); and Bibb County (Macon) (15.6 percent).
The analysis also used data from ClosingCorp to look at closing costs in the various counties. These costs included title, settlement services, appraisal, transfer taxes, recording fees and home inspection, which are common closing costs nationwide. The report found that the average closing costs across all 414 counties for sales in 2016 were $3,815, representing an average of 1.8 percent of the median sales price in each county and an average of 8.0 percent of the annual wages in each county. Costs however ranged as high as $48,153 in Kings County, $20,832 in New York County, and $15,908 in Queens County, all in New York State. The District of Columbia, Suffolk County (Long Island), Alameda County, and Bronx County were all above an average of $10,000.
Markets with the lowest closing costs were all in Missouri and were all in the $1,700 to $1,800 range.
Carol Crawford, senior vice president of marketing communications at ClosingCorp said, "When it comes to closing costs, there are many nuances. For example, the taxes based on the purchase price in most markets are typically paid by the seller, but there is one notable exception: the so-called 'Mansion Tax,' which is prevalent throughout New York and is paid by the buyer. The Mansion Tax of 1 percent applies when the purchase price is $1 million or more and it applies to the entire purchase price. Thus, a price increase of one thousand dollars from $999k to $1 million triggers a $10,000 Mansion Tax, which can be a big surprise if you are not a well-informed borrower."


