While it seems counterintuitive, could higher home prices lead an increase in home sales? Two Federal Reserve Bank of San Francisco senior economists, William Hedberg and John Krainer think so as explained in an Economic Letter titled Why Are Housing Inventories Low? It's not that higher prices will entice buyers, but rather, they may motivate sellers to help increase inventory.
For-sale inventories have been slow to rebound from the Great Recession even though home prices have increased steadily since 2012. Hedberg and Krainer theorize that prices are still not high enough to entice many sellers. For some this is because the value of their home is still below the outstanding balance on their mortgage, meaning that sellers would have to bring cash to the closing. For others it may be that their equity is not back to a level that motivates them to sell.
Economic theory suggests that all homes are for sale if the price is right, but at any point in time, the price may not be right. Sellers have their own ideas about what is "right" and must also consider that selling a house can be costly because of brokerage fees, and necessary or cosmetic changes to the house. For these reasons and others the active listing a home is viewed by economists as a strong signal of an intent to sell and they measure the short-run supply of homes for sale, the inventory, by the listing numbers.
Good times or bad, there is always some level of inventory in the housing market. Some owners sell to move up, others to downsize, other move for employment reasons, or to free up cash. These are life-cycles motives not necessarily tied to the business cycle and produce a general level of churning in the market. Nevertheless the authors say there is a distinct cyclical pattern to inventories which rise in good times and fall in bad times.
Credit conditions, which are also cyclical, can account for some of this. Risk premiums charged by lenders and their willingness to lend tend to ease during good economic times, allowing more potential buyers to enter the market. But it is the level of house prices which is by far the variable that most influences the inventory of homes for sale.
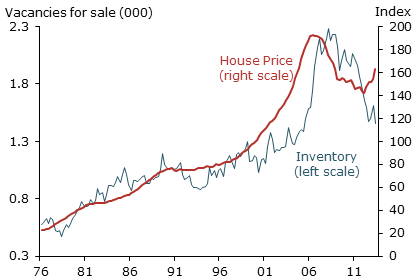
Even though not all listed homes are vacant Census Bureau data on the numbers and price level of vacant homes have a long history of indicating the relationship between inflation-adjusted house prices and for-sale inventory. As Figure 1 shows, inventories generally move with prices and changes in house prices have a causal effect on inventories. The two series are tied together in a long-run relationship and the authors say this makes sense as rising house prices should encourage homeowners to sell and thus inventories to rise.
fig. 1

Inventories do not instantly react to house price changes and other economics can disrupt the price/inventory relationship as is evident in the most recent time period in the figure above. House prices have been recovering broadly since 2012 but inventories have been declining. Only recently have they begun to rise.
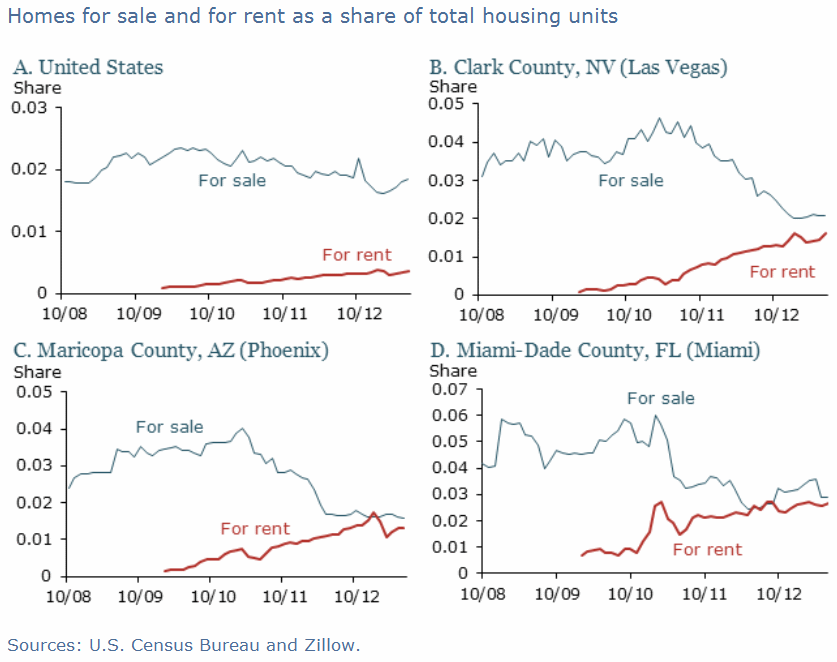
The relationship between inventory and prices may have broken down for an extended period as the market rebounded in 2012 because of fallout from the housing boom and bust. The boom saw an unprecedented rise in homeownership rates with younger households more willing to buy and eased lending allowing in less qualified borrows. When those trends reversed the inventory shifted from homes for sale to homes for rent with the later rising steadily during the recession and the for-sale inventory dropping and only recently stabilizing.
The authors say the data does not go back far enough to show if this is a typical reaction but some Census Bureau data suggest it is unprecedented since the 1960s. The phenomenon is widespread and cannot be accounted for solely by the surge in foreclosures. The inventory of homes in foreclosure has recently been falling in most markets but the ratio of owner occupied and renter occupied units has remained down. Thus, either preference for homeownership has shifted or, more likely, credit constraints have affected household home purchase decisions.
The changes in for-sale and for-rent inventories are seen most dramatically in markets like Las Vegas, Phoenix and Miami where foreclosures were high and investors have been buying large numbers of the foreclosed properties. In these market the total inventory of homes for rent is approaching that of homes for sale, a remarkable shift that has continued throughout the recovery. But, in addition to the investor-effect the decline in homes for sale is very closely linked with the large downward shift in the homeownership rate in these markets. It is impossible to say though whether declining sales are pushing down homeownership rates or falling homeownership is pushing down sales, or both are interacting with each other in a complicated feedback process.

Tight credit conditions may be affecting both the ownership decisions of young buyers and the supply side of the market. In theory, falling house prices alone may keep some homeowners from selling. It may seem logical that decisions to sell should be based only on information about current and future market conditions and the authors point to research that shows homeowners take more time to sell if home prices have fallen since the original purchase. That is, two similar homeowners experiencing similar housing market conditions will behave differently if one of those homeowners has an unrealized loss on his or her house.
Falling prices may hold down home sales for several reasons. An underwater homeowner may be unwilling or unable to make up the difference between sale proceeds and mortgage balance and chose to delay selling. Even if there is equity, it may be reduced enough that no cash is available for the downpayment on another home.
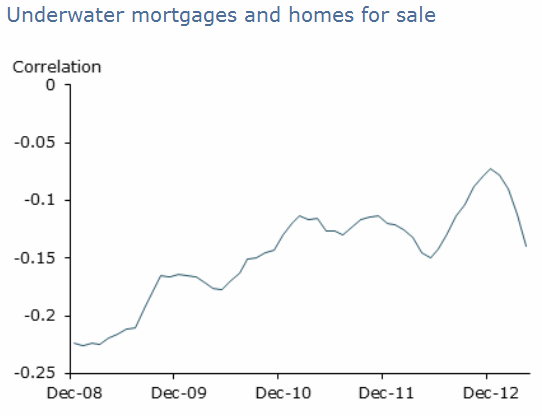
Since early 2008, homes for sale and homes underwater have been negatively correlated. Counties with a high share of underwater mortgages have tended to have smaller for-sale inventories. The authors say that while this relationship is significant, its strength diminished as the recovery got under way. Underwater borrowers may have been locked into their houses in a way that impaired the normal functioning of the housing market. But that effect seems to be waning.

Another explanation for this breakdown is that homeowners may be taking a longer view of the market. In the housing cycle price changes are persistent, that is both price rises and price drops are likely to be followed by more of the same. Homeowners who can be flexible on timing a sale can take advantage of this persistence, waiting and gambling that increases will continue and they can sell at a higher price.
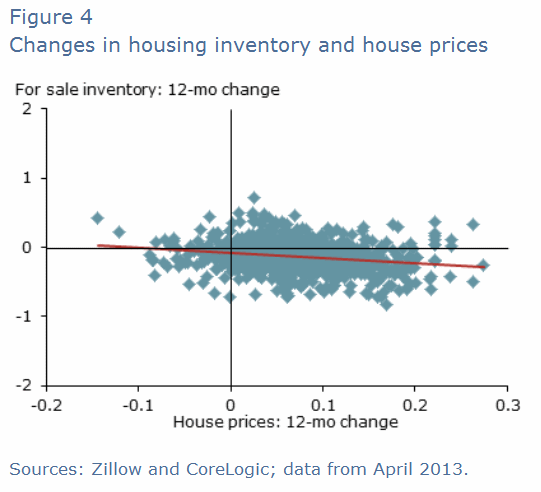
Figure 4 confirms on a county level the negative relationship between prices and inventories shown at the aggregate level in Figure 1. Where counties experienced relatively large price increases they also saw for-sale inventories decline.

The authors say it turns out that that variables such as recent house price appreciation and changes in employment are the most robust predictors of recent changes in housing inventory. Once these are accounted for other variables, such as changes in the for-rent inventory, the underwater share, or local price-rent ratios, do little to explain the inventory of houses for sale. "Thus, current homeowners may be making a rational choice to postpone selling in the hope that prices will rise further. However, this behavior tends to be short run. In the longer run, the link between the level of house prices and for-sale inventories is strong. If prices continue to rise, inventories for sale should eventually rise too."
Conclusion
History shows a long-run relationship between house prices and the number of houses available for sale. Thus, current inventories of homes for sale are low given more than a year of house price appreciation. County-level data suggest that many homeowners are waiting for prices to rise further in their markets. Markets that have seen the strongest house price appreciation and job growth are the ones where for-sale inventories have declined the most.


