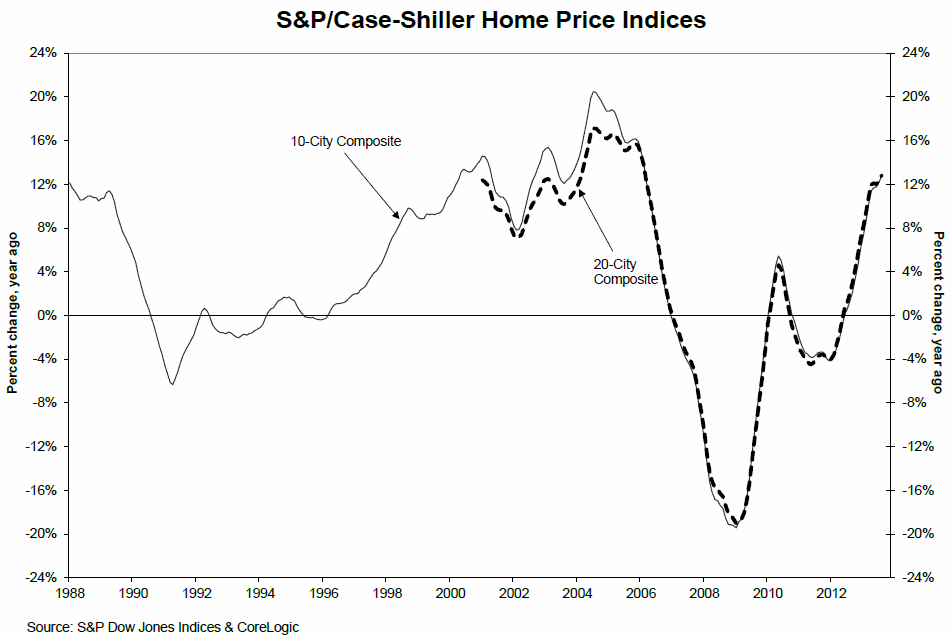
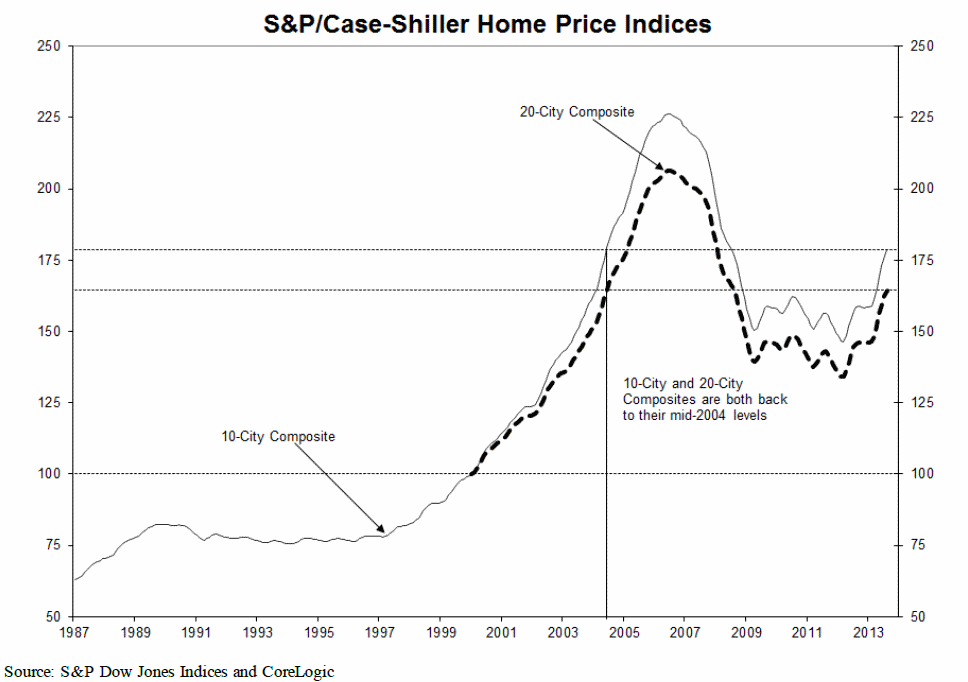
Both the 10-City and 20-City S&P-Case-Shiller Home Price Indices gained 1.3 percent in August to values of 175.8 and 164.53 respectively. These increases were substantially smaller than those in the June-July period of 1.9 and 1.8 percent and the 2.2 percent price appreciation posted by both indices from May to June.
All twenty cities posted monthly gains in August, although most cities showed deceleration compared to July. Las Vegas was at the top of the range with appreciation of 2.9 percent, its greatest since August 2004. Detroit and Los Angeles followed with gains of 2.0 percent. Seattle was at the bottom with a positive return of 0.5 percent. Month-over-month, San Francisco has been losing momentum as prices increased 4.9 percent in April 2013 and 0.9 percent in August 2013.
The August numbers were 12.8 percent higher than one year earlier for both the 10- and 20-City composites, slightly larger than the respective July increases of 12.3 and 12.4 percent. The rate of annual increases was also higher than in July in 14 of the 20 metropolitan areas with the largest in Las Vegas (29.2 percent), San Francisco (25.4 percent), Los Angeles (21.7 percent) and San Diego (21.5 percent.) The smallest year-over-year increase was in Cleveland at 3.7 percent.

"The 10-City and 20-City Composites posted a 12.8% annual growth rate," says David M. Blitzer, Chairman of the Index Committee at S&P Dow Jones Indices. "Both Composites showed their highest annual increases since February 2006. All 20 cities reported positive year-over-year returns. Thirteen cities posted double-digit annual gains. Las Vegas and California continue to impress with year-over- year increases of over 20%. Denver and Phoenix posted 20 consecutive annual increases; Miami and Minneapolis 19. Despite showing 26 consecutive annual gains, Detroit remains the only city below its January 2000 index level.
Blitzer said the peak rate of gain in home prices occurred in April. Since then, while prices have continued to rise, the gain has been more moderate, slowing each month. "This month 16 cities reported smaller gains in August compared to July. Recent increases in mortgage rates and fewer mortgage applications are two factors in these shifts," Blitzer said.
As of August average home prices across the U.S. had returned to mid-2004 levels. Since peaking in June/July 2006, peak to current prices are down about 20-21 percent for the two composites and they have recovered from their March 2012 lows by slightly over 22 percent. Blizer noted, "Denver and Dallas again set new highs. All the other cities remain below their peaks. Boston and Charlotte are the two MSAs closest to their peaks with only 8-9% left to go. Las Vegas is still down 47.1% from its peak level."

The Case-Shiller numbers echo those of other studies showing that price growth is moderating. Their figures however remain much more aggressive than others recently released for August. The Case-Shiller numbers do not claim to be national but rather reflects the experiences of 20 cities and all four studies use different data sets and different methodologies. Still the comparison is interesting. The other three sets of numbers below are from Lender Processing Services (LPS), CoreLogic, and the Federal Housing Finance Agency (FHFA). Number represent a percentage increase in their respective indexes.
|
Index |
July to August |
August 2012 - August 2013 |
|
Case-Shiller (20-City) |
1.3 |
12.8 |
|
CoreLogic |
0.9 |
12.4 |
|
LPS |
0.4 |
9.0 |
|
FHFA |
0.3 |
8.5 |
The S&P/Case-Shiller Home Price are constructed to accurately track the price path of typical single-family homes located in each metropolitan area provided. Each index combines matched price pairs for thousands of individual houses from the available universe of arms-length sales data. The indices have a base value of 100 in January 2000; thus, for example, a current index value of 150 translates to a 50 percent appreciation rate since January 2000 for a typical home located within the subject market.


