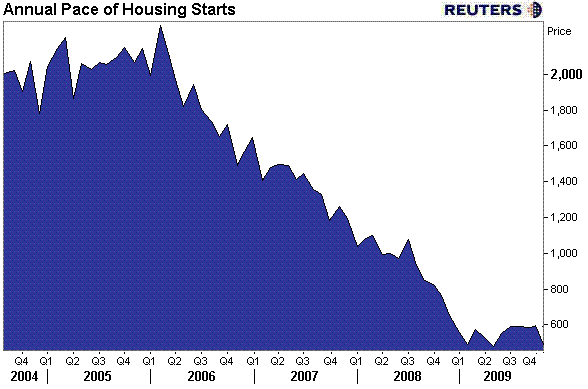
The Commerce Department released October New Residential Construction: Building Permits, Housing Starts, and Housing Completions data this morning.
Housing Starts data estimates how much new residential real estate construction occurred in the previous month. New construction means digging has begun. Adding rooms or renovating old ones does not count, the builder must be constructing a new home (can be on old foundation if re-building). Although the report offers up single family housing, 2-4 unit housing, and 5 unit and above housing data, single family housing is by far the most important as it accounts for the majority of total home building.
Building Permits data provides an estimate on the number of homes planning on being built. It tracks how much future construction activity we can expect to take place. This data is a part of Conference Board's Index of Leading Economic Indicators.
READ MORE ON HOW THE DATA IS COLLECTED
In last month's data, which reported on construction in September, new housing starts rose less than expected to 590,000 annualized units from a revised lower 587,000 pace in August, economists were expecting a rise of 610,000 units. The rise in new housing starts was a factor of a 3.9% increase in single family construction starts while multifamily starts fell by 15.2%. Building permits, an indicator of future construction activity, fell by 1.2% to 573,000 annual units led by a 3.0% decline in single-family permits. Multi-family permits rose by 6.0% to 123,000 annualized units.
In last month's housing starts commentary, we stated that the decline in single family building permits indicated housing starts would continue to slow in the months to come. This was indeed the case in September as housing starts fell 10.6% from the September read, their lowest level in six months, led by a 6.8% decline in constuction of single-family dwellings and 34.6% drop in multi-family starts.
---------------------------------------------------
From the Commerce Department...
BUILDING PERMITS
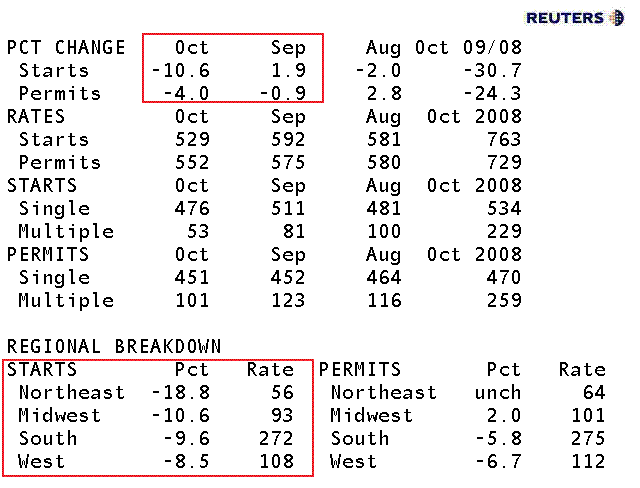
Privately-owned housing units authorized by building permits in October were at a seasonally adjusted annual rate of 552,000. This is 4.0 percent (±1.9%) below the revised September rate of 575,000 and is 24.3 percent (±1.9%) below the October 2008 estimate of 729,000.
Single-family authorizations in October were at a rate of 451,000; this is 0.2 percent (±1.0%) below the revised September figure of 452,000. Authorizations of units in buildings with five units or more were at a rate of 85,000 in October.

HOUSING STARTS
Privately-owned housing starts in October were at a seasonally adjusted annual rate of 529,000. This is 10.6 percent (±8.7%) below the revised September estimate of 592,000 and is 30.7 percent (±8.3%) below the October 2008 rate of 763,000.
Single-family housing starts in October were at a rate of 476,000; this is 6.8 percent (±7.5%)* below the revised September figure of 511,000. The October rate for units in buildings with five units or more was 48,000.

HOUSING COMPLETIONS
Privately-owned housing completions in October were at a seasonally adjusted annual rate of 740,000. This is 1.9 percent (±12.4%) above the revised September estimate of 726,000, but is 29.9 percent (±9.7%) below the October 2008 rate of 1,055,000.
Single-family housing completions in October were at a rate of 528,000; this is 10.7 percent (±14.5%)* above the revised September figure of 477,000. The October rate for units in buildings with five units or more was 200,000.
-----------------------------------------------------
While we anticipated construction data would decline in October, today's data was a big surprise to most market participants as economists were expecting housing starts to increase to 600,000 and permits to rise to a 580,000 annual rate.
As you can see in the table below, both starts and permits were WELL BELOW last month's read and much worse than forecast.

A few observations...
This month, ground breaking on single family homes accounted for 90% of all new starts. Last month single family dwellings only accounted for 86% of all new starts. In August, single-family dwellings made up 83% of all new housing starts. I am pointing this out to illustrate continued weakness in commercial real estate. Adding support to that observation was the 18% decline in multi-family building permits in October. Not great implications for future commercial building.
While weakness in commercial real estate is growing, I should remind that single family construction carries the most weight in this report. In that regard....while the backward looking aspect of the report, housing starts, was notably weaker, the more important, forward looking aspect of the release, building permits, only fell by 0.2%.
Although still a contraction, I view this small decline as being a result of home builders putting construction plans on hold while the home buyer tax credit extension legislation was still undetermined. So more than anything I think it's fair to say the most meaningful indicator of home building activity was in STATUS QUO mode for the month of October.
The outlook for housing will however remain a debate in the media because of the extension of the home buyer tax credit. While we do anticipate the tax credit to add demand to the 2010 housing outlook, we also expect a few factors to contain new construction and overall housing market momentum in 2010. Specifically...
- some of 2010's demand was likely stolen by 2009 as first time home buyers rushed to beat the previous expiration
- many regions don't need to add housing supply. Plus foreclosures are expected to continue and shadow inventory is an unknown variable
- tight credit. DU 8.0 and a media spotlight on the FHA will only make underwriting guidelines tighter and mortgage credit more expensive
- the Fed's exit from the MBS market. Who will provide liquidity? FN/FRE? FHA? Cash heavy banks? New financial regulations may limit bank participation. See above re: GSEs and FHA
- JOBS JOBS JOBS...buyers can't qualify without a J.O.B
Thoughts?


