Lender Processing Services (LPS) Mortgage Monitor for October reports that 48 percent of outstanding second lien home equity lines of credit (HELOCs) were originated between 2004 and 2006 and the vast majority have draw periods of 10 years. Therefore these loans are set to begin amortizing over the next several years and many borrowers may see monthly payments increase. According to LPS Senior Vice President Herb Blecher, recent increases in new problem loans among the HELOCs originated prior to 2004 (that have already begun amortizing) indicate increased risk of more delinquencies ahead.
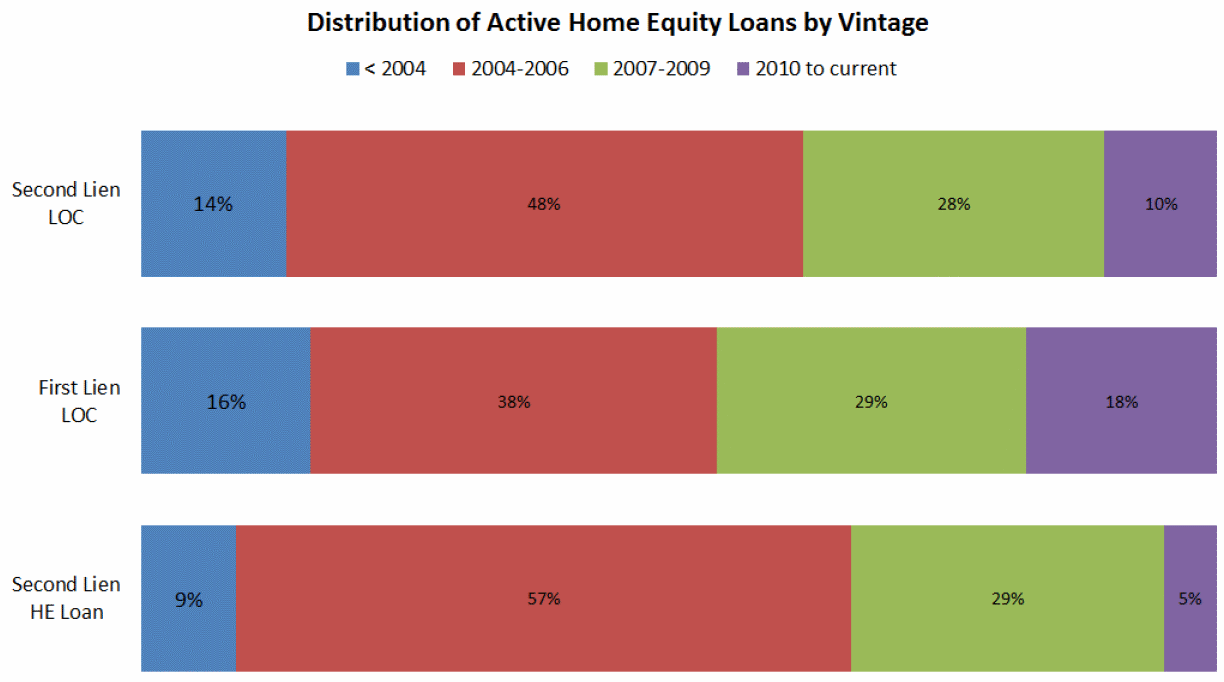
"In the aggregate, the home equity market is experiencing lower delinquencies," said Blecher. "However, among the HELOC population that has already begun amortizing, we are actually seeing an increase in new seriously delinquent loans. As of today, only 14 percent of second lien HELOCs have passed this 10-year mark, leaving a very large segment of the market at risk of payment increases over the coming years. Nearly half of all of these lines of credit were originated between 2004 and 2006, with the oldest set to begin amortizing next year. If this trend toward post-amortizing delinquencies carries over, we could be looking at significant risk to the home equity market over the coming years.
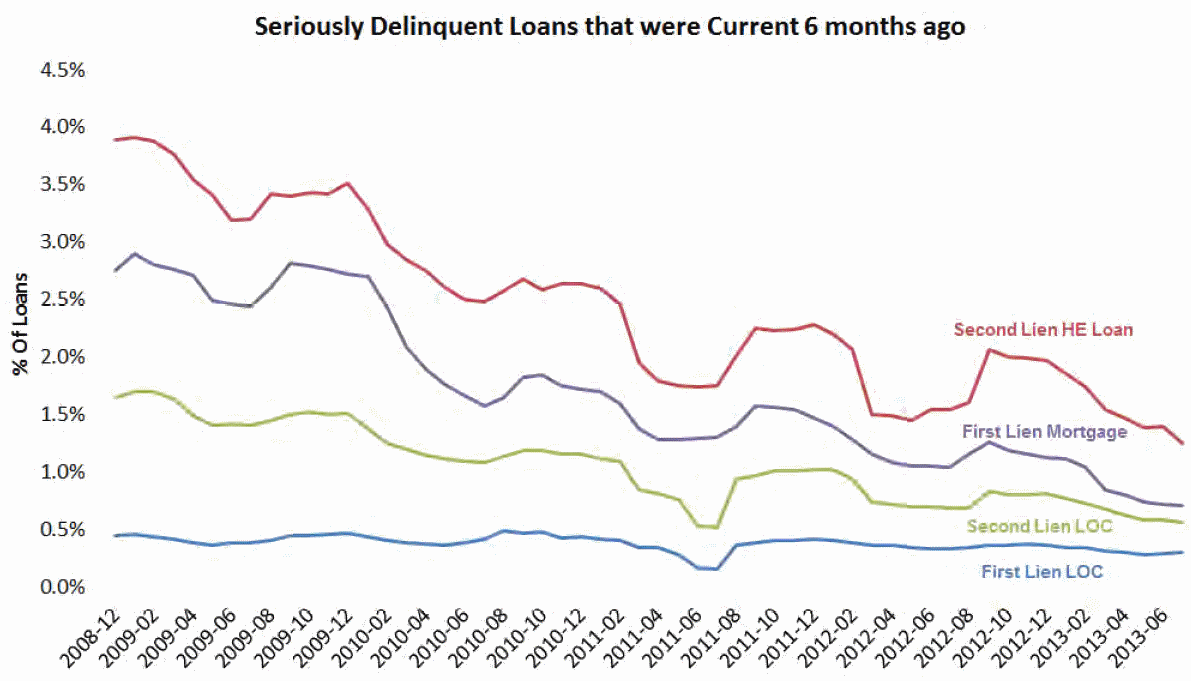
In addition to the current risks posed by the home equity market the Monitor focuses on:
- Prepayment activity, mortgage originations, and property sales
- Home prices and negative equity
- Judicial vs. non-judicial state disparities
The company reports that prepayments dropped again in October to around 4.3 percent of mortgages. As recently as May of this year prepayments were running near 6.5 percent. While the rate of repayments continues to drop, the decline slowed with retreating rates in October.
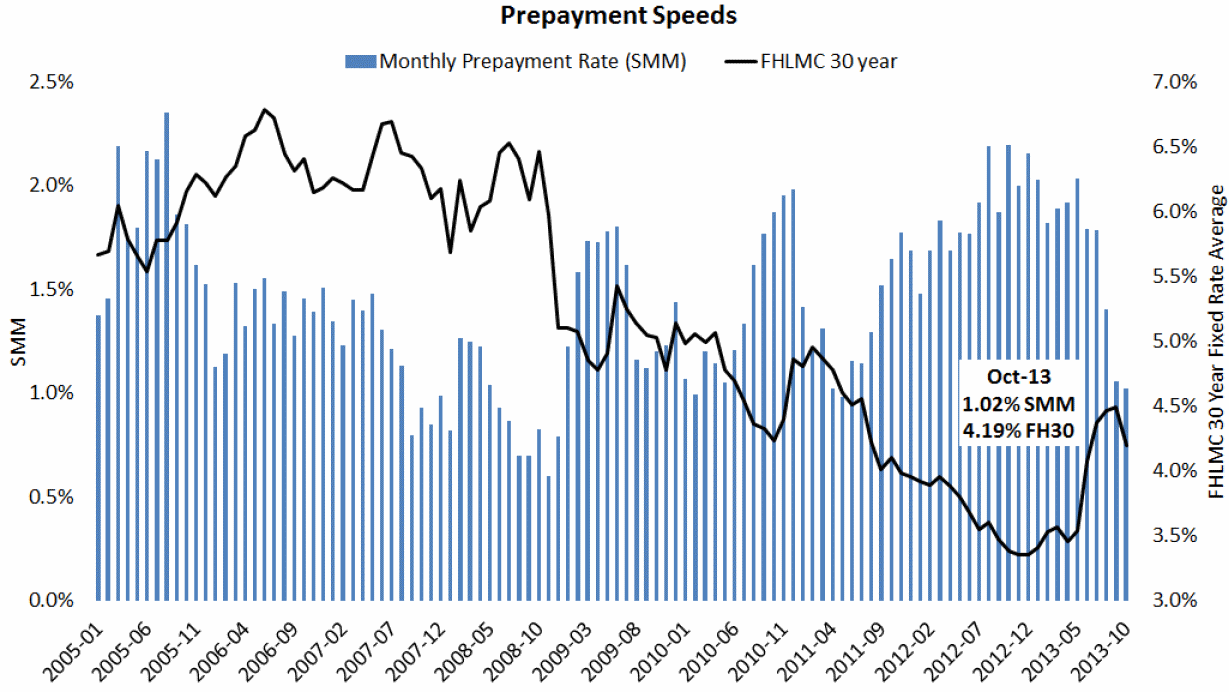
Mortgage originations are down sharply, having dropped 43 percent since June. The decline has been driven in large party by refinancing which represented 50 percent of originations in October compared to 75 percent at the beginning of 2013.

Home sales have also pulled back from recent peaks this past summer but the ratio of distressed sales to equity sales is improving. Only 14.2 percent of sales in September were owned real estate (REO) or short sales, the lowest percentage since 2007.
Home prices are up about 9% year over year to an average of $232,000 but were up only 0.2 percent month-over-month as seasonal slowing continued. Nationally prices are about halfway back from the $202,000 low point of January 2012. Prices peaked in June 2006 at a national average of $270,000
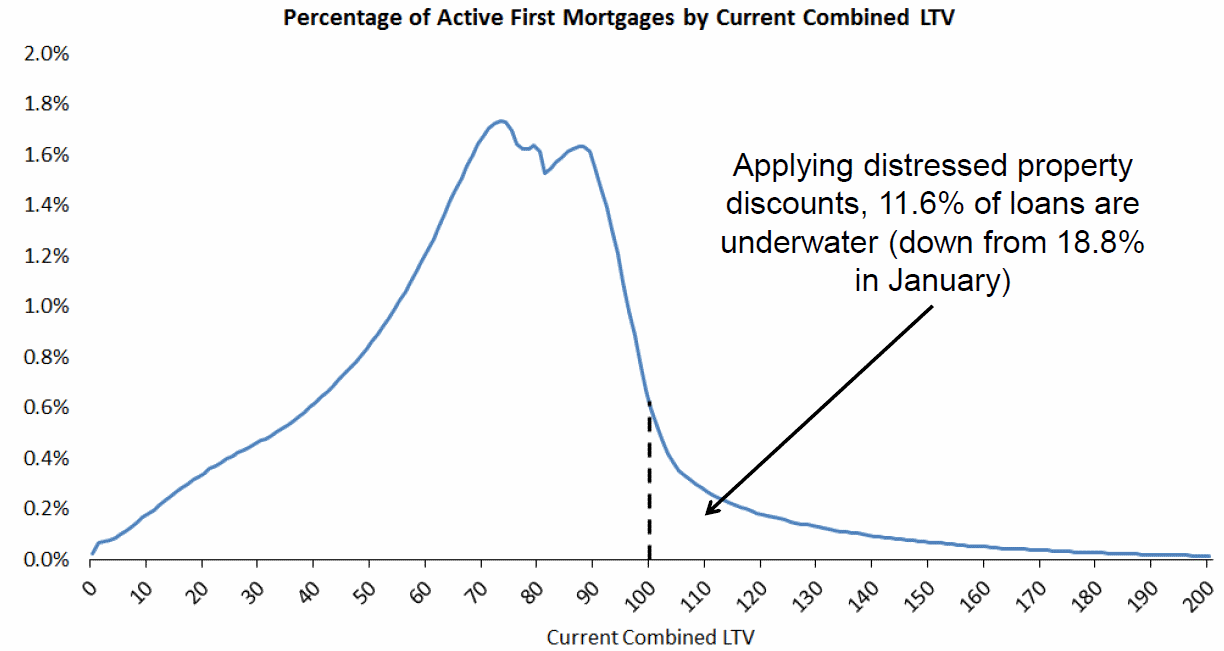
Home price improvement is driving negative equity lower. LPS estimates that about 11.6 percent of loans remain underwater compared to 18.8 percent at the beginning of the year. LPS says that negative equity estimates vary widely so it has a adopted a new methodology that accounts for not only the current combined loan-to-value (LTV) ratio of all mortgages but also the impact of distressed sale discounts on loans in serious delinquency or foreclosure. As the negative equity situation improves, the volume of short sales has dropped from 56 percent of distressed sales in September 2012 to 44 percent this past September. The discounts offered for short sales are declining as sales volumes decrease.
Judicial states are lagging in price recovery since the national trough in January 2012. As can be seen from the graphic, with the exception of Florida all of the states where prices have increased more than 15 percent above that trough are non-judicial states.
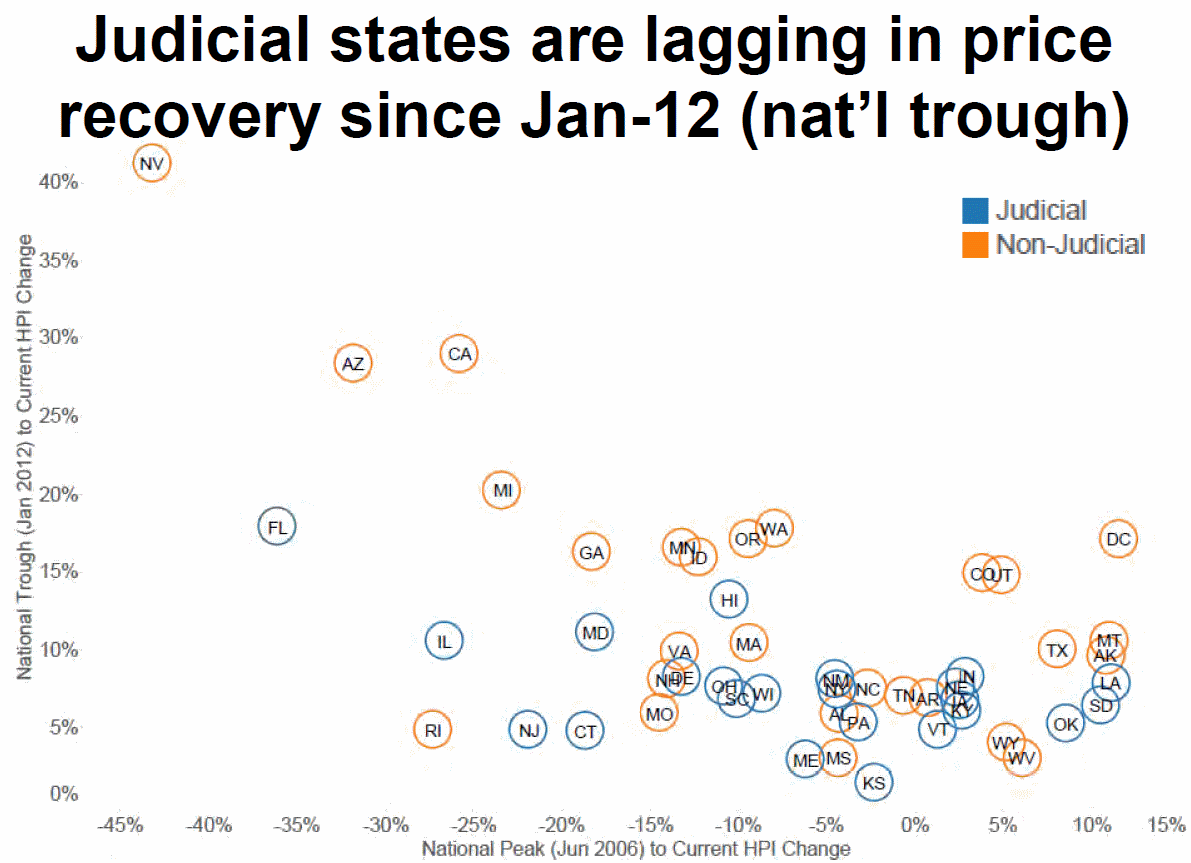
New problem loans are increasing in both judicial and non-judicial but the rate is higher in the former and the gap between the two is growing. Foreclosure starts are also still elevated in judicial states where they increased 12 percent from August to September while starts declined by 5 percent during the same period in non-judicial states. However, increasing levels of foreclosure sale activity have helped improve pipeline ratios (the ratio of loans that are seriously delinquent and in foreclosure to the six-month average of foreclosure sales) in judicial states. The judicial state pipeline ratio had declined from a high of 118 months of inventory, down to 47 months as of October, much closer to the non-judicial states' 39 months of inventory.


