Could mortgage fraud be coming back? According to Bret Fortenberry, writing in CoreLogic's Insights blog, there are indications the incidence is rising. Fortenberry says the housing industry professionals agree that origination fraud peaked between 2005 and 2008, a period that offered unprecedented opportunities to manipulate the system. The increase regulation, improved controls, and tightened lending standards that followed strongly reversed the trend and fraud rates have been very low in the last several years.
Looking toward 2016 however Fortenberry says that it is likely the loosening credit guidelines and a recovery of the purchase mortgage market will again return some of the opportunities and motivation for fraud. One possibility is that inflated home prices will be used to cover misrepresentation of down payments.

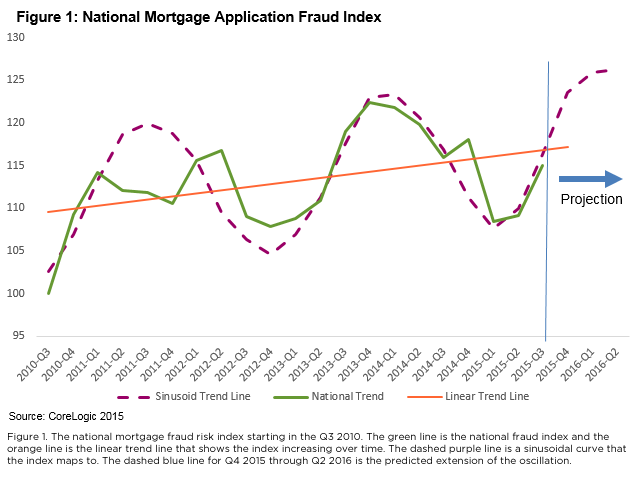
CoreLogic began tracking mortgage fraud risk in the third quarter of 2010. Since then fraud risk, as shown in Figure 1, has oscillated but the trend has been for fraud to increase on a national basis. The green line in Figure 1 represents the national fraud index and the purple line shows a predictive oscillation path the index has been following.
The last peak in the mortgage fraud index occurred in the first quarter of 2014 with a decreasing trend until the first quarter of 2015. The index leveled off and then started to climb in the third quarter of 2015, an increase that can be attributed to an improving job market and continuing low mortgage interest rates. Fortenberry expects both the pattern and the trend to continue; predicting that the nation is on the bottom cusp of the next period which could peak around the second quarter of 2016, reaching the highest level of risk since 2010.
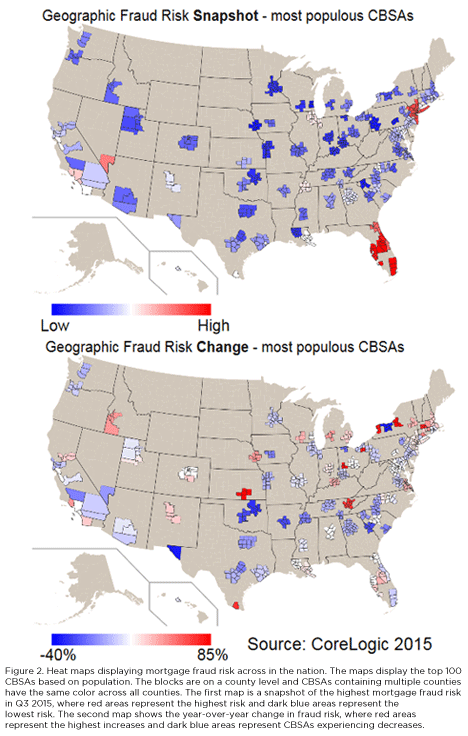
The increase in mortgage fraud risk is also shifting from historically risky markets to those that have been lower-risk. During 2014, the national fraud risk index decreased overall but in some markets such as Florida, New York, and New Jersey the risk continued to rise. Those regions have now stabilized at a high-risk level along with Las Vegas, Los Angeles and Chicago which have been high risk since early 2014. Now there are stirrings of risk in regions that previously had relatively little of it.
CoreLogic has produced two heat maps of the 100 largest Core Based Statistical Areas (CBSAs). The first is a snapshot of fraud risk in the third quarter of 2015 demonstrating the concentration of the highest fraud risk in several Florida population centers and in the New York/New Jersey region with Las Vegas following slightly behind.

The second heat map shows the year-over-year change in risk. It reveals that the top five growing regions, in descending order are Wichita, Dayton, Syracuse, Akron, and Springfield, Massachusetts. None of these areas are currently ranked in the top 30 percent for fraud risk but their risk has increased by 86 percent year over year in Wichita down to 48 percent in Springfield. They are followed by five other CBSA's where risk has increased by at least 24 percent; Buffalo, McAllen, Texas; Knoxville, New Haven-Milford, and Oxnard-Ventura. The last two of those already rank in the second tier of riskiest areas at numbers 15 and 13 respectively so if their current rate of increase continues they can be expected to rank among the top ten for risk by next year.
Two-thirds of the U.S. population lives in the top 100 CBSA but CoreLogic has found a correlation between rapidly growing CBSAs and increasing mortgage fraud risk. North Dakota is an interesting example of a lower-risk region that is experiencing a rise in fraud risk. The recent oil boom has brought new businesses and population migration to Williston N.D., the fastest growing micropolitan (and thus not included in the top 100 CBSAs) area in the state This is contributing to the state's rapid increase in occupancy fraud and income fraud risk, 175 percent and 550 percent year over year, respectively.


