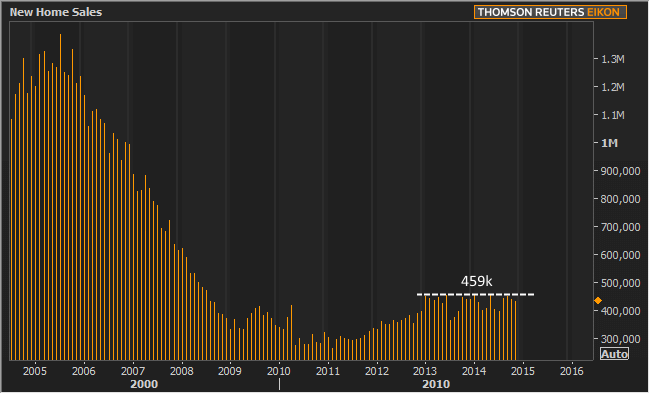
Sales of new homes fell in November, coming in 1.6 percent below sales the previous month. The U.S. Census Bureau and the Department of Housing and Urban Development said today that November sales were at a seasonally adjusted annual rate of 438,000 units compared to the revised October rate of 445,000 units. The revision to the October number, bringing it down from the originally reported 458,000 units, also wiped out the earlier estimate of a 0.7 percent increase from September.
The November number was slightly higher than for new home sales one year earlier. The seasonally adjusted annual rate in November 2013 was 445,000. Despite the year-over-year gain, the longer term trend is not only flat, but also consistently capped by a maximum annual pace of 459k since the beginning of 2013.

On a non-adjusted basis there were an estimated 31,000 new homes sold during the month compared to 36,000 sold in October. New homes sales year-to-date at the end of November total an estimated 406,500 units.
The median price of a new home sold in November was $280,900 and the average sales price was $321,800. In November of 2013 those numbers were $277,100 and $335,600 respectively.
At the end of the reporting period there were an estimated 213,000 newly constructed homes for sale nationwide. At the current rate of absorption the Census Bureau and HUD estimate this as a 5.8 month supply.
New home sales were down in three of the four regions compared to the previous month. Sales in the Northeast declined12.0 percent from October and were exactly one-third lower than sales a year earlier. The Midwest saw a month-over-month drop of 6.3 percent but sales were 3.5 percent higher than in November 2013. The South posted lower sales for both time periods, down 6.4 percent and 4.1 percent respectively. The sole region to improve was the West which posted a 14.8 percent increase in sales compared to October and was up 10.7 percent from a year earlier.


