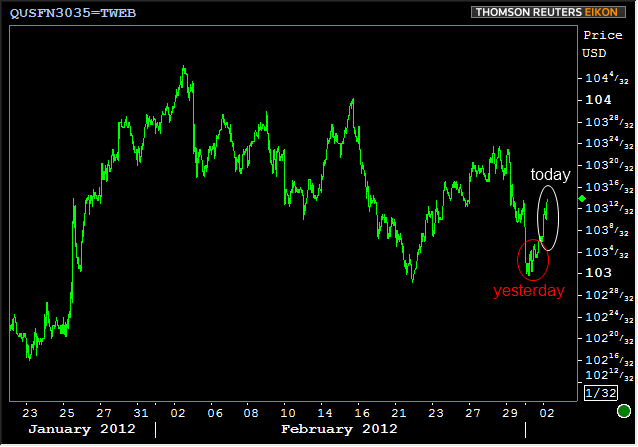
It's been a good morning so far for production MBS as Fannie 3.5's are back above price levels from Wednesday afternoon. Improving the situation is some better than expected volume on what should have been an uneventful morning. Actually, the morning only "should have been" uneventful barring any unexpected European motivations and we are, in fact, seeing some.
Spain is today's European flavor of the day after going against a previous agreement with the EU to set its deficit target at 4.4 percent of GDP in favor of 5.8 percent. While infinitely more realistic for the ailing Spanish economy, which today revised it's 2012 GDP forecast down to -1.7 percent from a +2.3 percent previously, this is yet another suggestion that the EU's fiscal pact is too tenuous to usher in a new era of Euro-zone stability.
The Euro has fallen off appreciably overnight and into the New York session. German Bunds have rallied appreciably, and US Treasuries are casually following. Not to be left out, MBS are in turn, casually following Treasuries as we here in the states have very little to go on today if not for keeping pace with our European markets of interest. As stated above, MBS are back above Wednesday afternoon's levels, and have strung together a nice little bounce back after taking the bulk of their losses before yesterday's open.

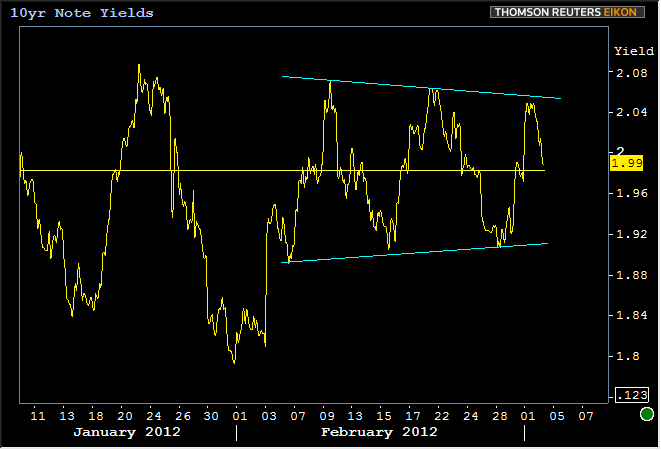
Although we can point to these overnight and ongoing European considerations and explain today's rally, we'd like to emphasize just how technically the market is trading. One of the shortest definitions of Technical Analysis is the notion that "Price Discounts Everything." In other words, the European news, past, present, and even expectations of future events, are all priced into trading levels. We noted the predictability of bond markets so far this month within this technical framework and the them continues today. What has February told us would happen after 10yr yields spend a few hours around 2.06? Naturally, we fall back to the high 1.9's. Naturally! (yes, this is a bit tongue-in-cheek, and we'd never presume to call the markets predictable BEFORE they actually demonstrate that quality. Too bad hindsight's not worth more...)

But there's an even more interesting dynamic at work in the long and short term charts. The following is the same long term chart that we've been following for a few days now, and the red trendlines have been in place on various iterations of this chart for several weeks now.

I've mentioned before that one of the things that I enjoy most about charting is that the trendlines that I set on long term charts retain their exact position as I zoom into shorter intervals. With that in mind, the following chart is the same chart as above, simply zoomed into a 1 minute interval as opposed to daily (note: the white moving average line is removed as it's set as a 100-day moving average on a daily chart, but turns into a 100 minute moving average on the 1-minute chart, thus not pertinent to this discussion).

The point here, for those who aren't already gasping in astonishment, is that all the little bounces against this morning's yield highs in 10's have occurred exactly on that long long long term trend channel support line. In other words, from a purely technical standpoint, the long term bullish trend in 10yr yields was TESTED this week, but if today's rally holds through 3pm, that test will NOT be confirmed as a break of the trend.


