The MBS market continues to trade quietly in its own world. This morning flows are thin (activity is light) and MBS remains stable while TSYs yields push higher. Mortgages continue to show resiliency and independence from the "stock lever" while the Federal Reserve's checkbook offsets any supply that is offered up to the mortgage market for bid. MBS/TSY yield spreads are mixed at the moment depending on your benchmark of choice. (Shorter duration as you head up the stack).
FN30_______________________________
FN 4.0 -------->>>> -0-04 to 100-01 from 100-05
FN 4.5 -------->>>> -0-04 to 101-24 from 101-28
FN 5.0 -------->>>> -0-02 to 102-31 from 103-01
FN 5.5 -------->>>> +0-00 to 103-25 from 103-25
FN 6.0 -------->>>> +0-00 to 104-15 from 104-15
GN30______________________________
GN 4.0 -------->>>> -0-04 to 100-05 from 100-09
GN 4.5 -------->>>> -0-05 to 101-27 from 102-00
GN 5.0 -------->>>> -0-04 to 103-14 from 103-18
GN 5.5 -------->>>> +0-00 to 104-02 from 104-02
GN 6.0 -------->>>> -0-01 to 104-17 from 104-18
Jobs data came in "as expected" and was actually much better than the "whisper numbers" proposed by many market watchers.
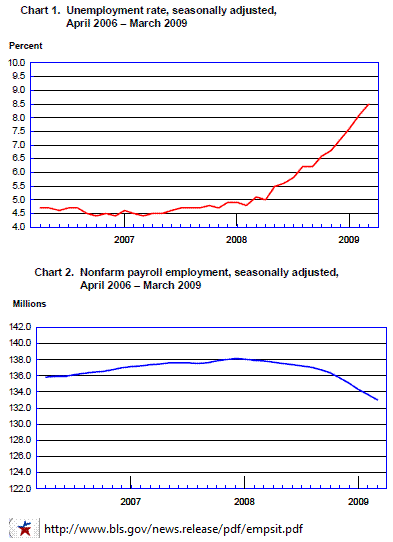
Nonfarm payroll employment data indicated that employers cut payrolls by -663,000 in March. The unemployment rate rose from 8.1% to 8.5%. Since the recession began in December 2007 the US Economy has shed 5.1 million jobs with 65% of the losses coming in the past three months. In the last twelve months the unemployment rate has risen 3.4%.
The Labor Department also revised the January data to 741,000 jobs losses. THAT IS THE BIGGEST MONTHLY DECLINE SINCE OCTOBER 1949!!!!!
- Manufacturing employment fell by 161,000 in March, with widespread job losses occurring among the component industries. Factory employment has declined by 1.0 million over the past 6 months
- The construction industry lost 126,000 jobs in March, with declines occurring throughout the industry. Employment in construction has fallen by 1.3 million since peaking in January 2007; nearly half of that decline occurred over the last 5 months
- Employment in professional and business services fell by 133,000 in March, with declines throughout most of the sector.
- Retail trade employment fell by 48,000 over the month. Since peaking in November 2007, employment in the industry has declined by an average of 44,000 per month
- Employment in financial activities continued to decline in March (-43,000). The number of jobs in this industry has dropped by 495,000 since an employment peak in December 2006
- Leisure and hospitality shed 40,000 jobs in March, with most of the decrease in the accommodation industry (-23,000).
- Transportation and warehousing lost 34,000 jobs in March
In March, the average work week for production and nonsupervisory workers on private nonfarm payrolls fell by 0.1 hour to 33.2 hours, seasonally adjusted-the lowest level on record for the series, which began in 1964. The manufacturing workweek decreased by 0.2 hour to 39.3 hours, and factory overtime was unchanged at 2.7 hours. In March, average hourly earnings of production and nonsupervisory workers on private nonfarm payrolls rose by 3 cents, or 0.2 percent,
Looking Deeper into the Data...
TABLE A-5
When people have a hard time finding a full time position, often times, they resolve themselves to take a part time job in order to make the "ends meet". Table A-5 shows us how many people are looking for part time work for economic reasons. When this figure is on the rise it implies the economy is weak and unable to create new jobs.
In March the total number of people working part time for economic reasons climbed by 423,000 to 9.0 million!!!
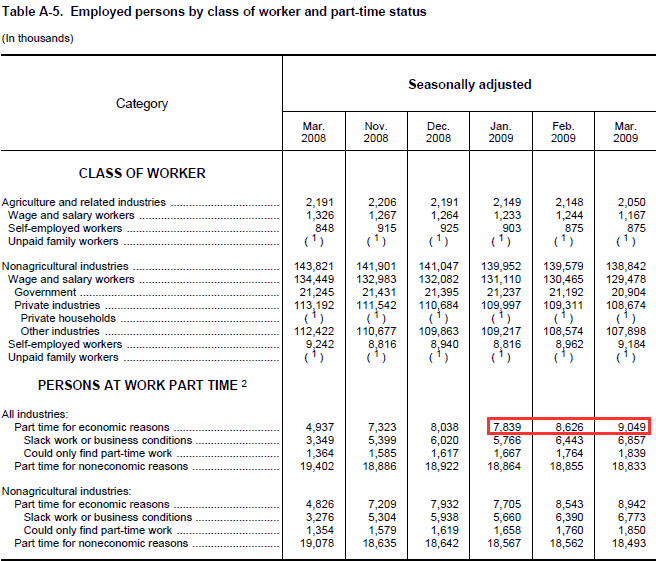
TABLE A-8
The number of workers who lost their jobs permanently is on the rise. This implies firms are making long term changes to their cost structures. Companies will be implementing new technology to increase productivity...this implies workers MUST be capable of operating and managing technological advances. Part of the reason President Obama is stressing education spending.
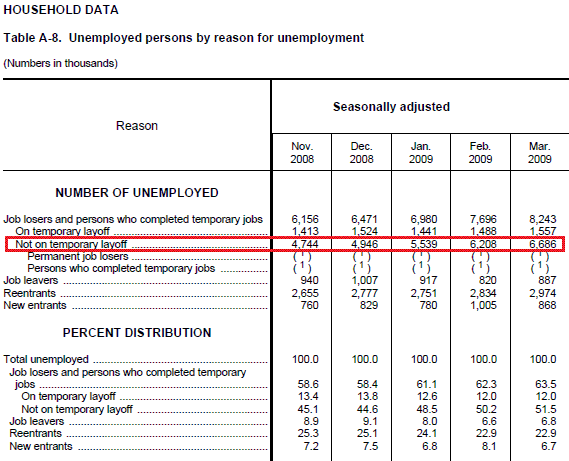
TABLE A-9
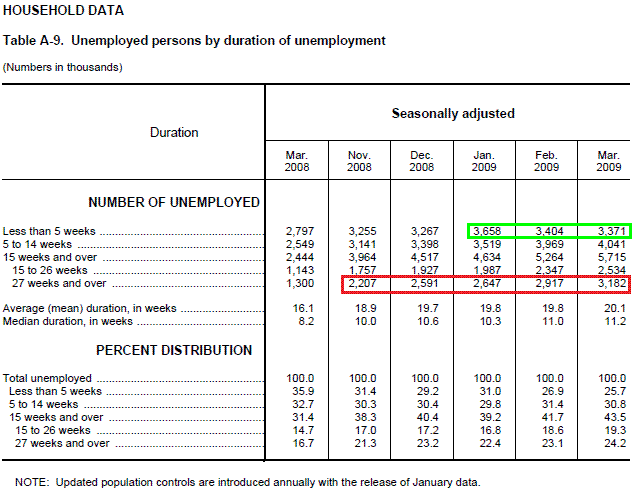
How long have people been unemployed? Sharp increases in people who have been unemployed for five weeks or less implies companies are laying off workers in greater numbers. This number decreased in March!!!! However, the number of unemployed for a period of 27 weeks or greater has bad implications for society because these are workers whose unemployment insurance has expired...and they are looking for food and shelter....the additional public welfare programs outlaid by the Obama Administration will help some of these people. Unfortunately the average time of unemployment is still on the rise and this has negative forward looking implications.
*********IF YOU SKIPPED OVER EVERYTHING ELSE....STOP AND READ THIS PART************
Does the official unemployment rate exclude people who have stopped looking for work?
Yes; however, there are separate estimates of persons outside the labor force who want a job,including those who have stopped looking because they believe no jobs are available (discouraged workers). In addition, alternative measures of labor under-utilization (discouraged workers and other groups not officially counted as unemployed)
The headline unemployment figures do not include marginally attached workers or discouraged workers. The BLS defines these workers as such:
"Marginally attached workers are persons who currently are neither working nor looking for work but indicate that they want and are available for a job and have looked for work sometime in the recent past. "
"Discouraged workers, a subset of the marginally attached, have given a job-market related reason for not looking currently for a job. Persons employed part time for economic reasons are those who want and are available for full-time work but have had to settle for a part-time schedule"
TABLE A-12...My preferred indicator of the health of the labor market: Alternate Measures of Labor Utilization includes these workers!!! There is a reason this table is hidden 20 pages into the press release...because it tells us the real unemployment rate!!!
"2.1 million persons (not seasonally adjusted) were marginally attached to the labor force in March, 754,000 more than a year earlier.....They were not counted as unemployed because they had not searched for work in the 4 weeks preceding the survey. Among the marginally attached, there were 685,000 discouraged workers in March, up by 284,000 from a year earlier. Discouraged workers are persons not currently looking for work because they believe no jobs are available for them. The other 1.4 million persons marginally attached to the labor force in March had not searched for work in the 4 weeks preceding the survey for reasons such as school attendance or family responsibilities."
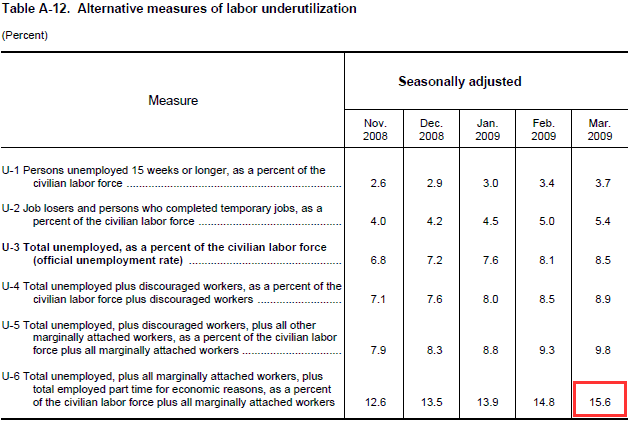
THE REAL UNEMPLOYMENT RATE: 15.6%
One has to wonder, given the HUGE REVISION of January NFP data, what revisions we are due for this month's data...do you think the government would purposely attempt to distort the emotions of investors for our own good?
I am heading up to State College, PA for my alumni weekend. Matt will be educating and enlightening you for the remainder of the day. Have a great weekend!


