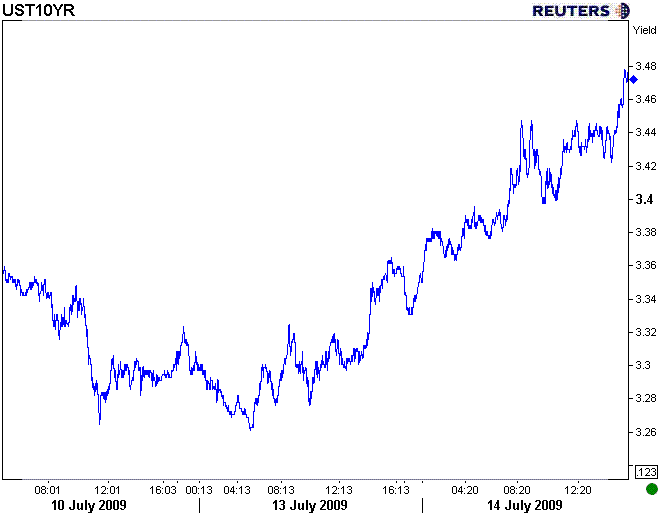
Interest rate option volatility has increased a few bps this afternoon...leading to lower TSY note prices and higher benchmark interest rates (some profit taking in there too). This has occurred in healthy volume as I see 820K 10 yr contracts traded today...compare that to the 505K traded yesterday. Even though short term technical indicators are pointing towards a bearish interest rate outlook, our long term charts are holding the overall bullish bias together...meaning we dont believe this is a long term shift in interest rate sentiment, more so short term corrections/poking and prodding at support to confirm long term bias.
Nonetheless traders are protecting positions from the possibility of a steeper yield curve by purchasing (and selling) options contracts, which has lead to increased volatility and higher benchmark yields. 3m/10yr bp Vol at 184...perspective: we were at 172 last week and 201 in mid June.
At the moment the 10 yr TSY note is down 30 ticks in price yielding 3.47%...looks like traders may look to confirm their long term bullish bias by testing 3.50% on the 10 yr. We see strong support in the 10 yr near 3.47% then 3.53%.

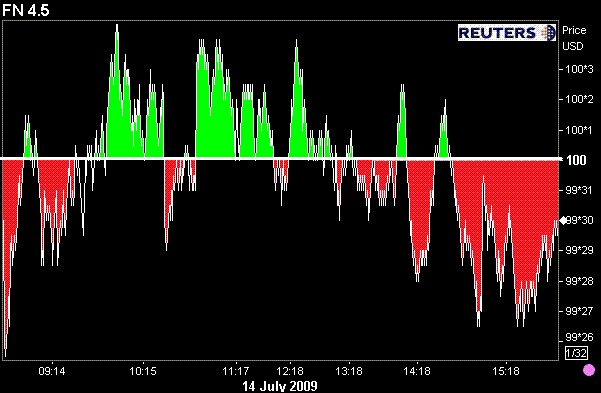
The falling 10 yr price (and rising 10 yr yield) has pressured "rate sheet influential" MBS prices lower...leading to some scattered reprices for the worse. It should, however, be pointed out that "rate sheet influential" MBS have been somewhat resilient to benchmark selling...meaning MBS yield are outperforming TSYs and MBS/TSY yield spreads are tighter. Tighter yield spreads/resiliency is a function of "bargain buying"....as the FN 4.5 dips below 100-00 it looks like some bankers (central and domestic) have jumped in to buy at the lows (yield spreads are still relatively cheap too!).Volume, although higher than recent norms, was still low in the MBS market. Check out the FN 4.5's battle with parnertia today...

In the stock market, volume remains LOW. S&P 905 resistance has held all day...
BUY THE RUMOR SELL THE NEWS is currently governing trading flows in the stock market. In the short term, closing above short term moving averages is an optimistic sign for stock traders. If stocks continue to move higher...912 is our next resistance level, if that level is broken....then 927 is next level of resistance...we do not want the S&P to break 912.

Again...I will reiterate: NO TREND OR BIAS WILL BE CONFIRMED UNTIL AT LEAST JP MORGAN, BANK OF AMERICA, AND CITI REPORT EARNINGS. Although the yield curve is currently reflecting an outlook for higher rates, the market's gyrations leading up to those releases will reflect a repositioning towards a more neutral risk stance (buying and selling options/futures!). It looks like NYMEX crude prices agree with this outlook as, once again, oil failed to hold gains over $60.
2s vs. 5s: 140bps
2s vs. 10s: 252bps
5s vs. 10s: 111bps


