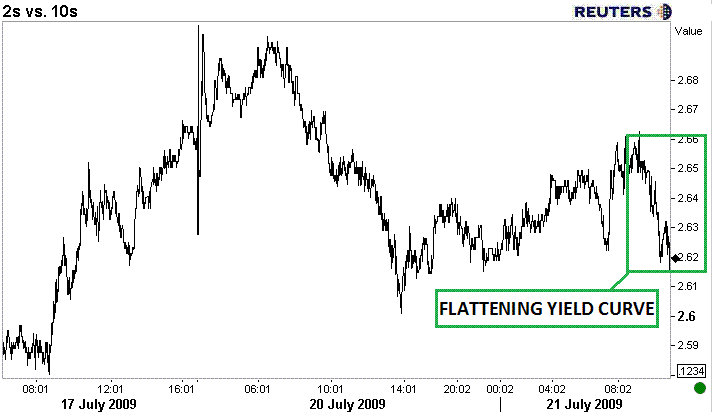
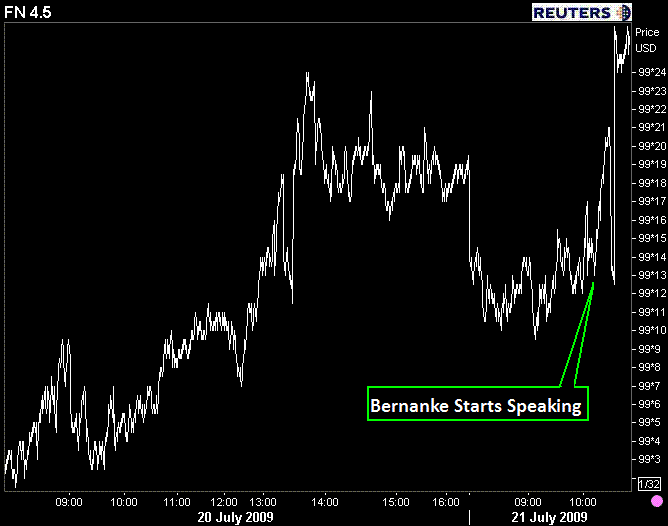
As Federal Reserve Chairman Ben Bernanke began his testimony before the House Committee on Financial Services...stock prices fell a few points and the yield curve flattened as long dated TSY note prices rose. Because the MBS coupon stack is taking directional guidance from the gyrations of the yield curve..."rate sheet influential" MBS prices rose too.
Flatter yield curve...

Higher "rate sheet influential" MBS prices...

This MBS rally is not a function of greater demand for mortgage-backs, it is not a factor of a rejuvenated bid side mortgage buying presence...the price gains come as a result of MBS traders adjusting their price tables to reflect a flatter yield curve. Volume in the mortgage market is light and trading flows are thin as most market participants are watching Bernanke on the boob tube. MBS will however continue to take directional guidance from the yield...just dont expect MBS to keep up with the TSY rally (yield spreads wider as TSYs outperform MBS).
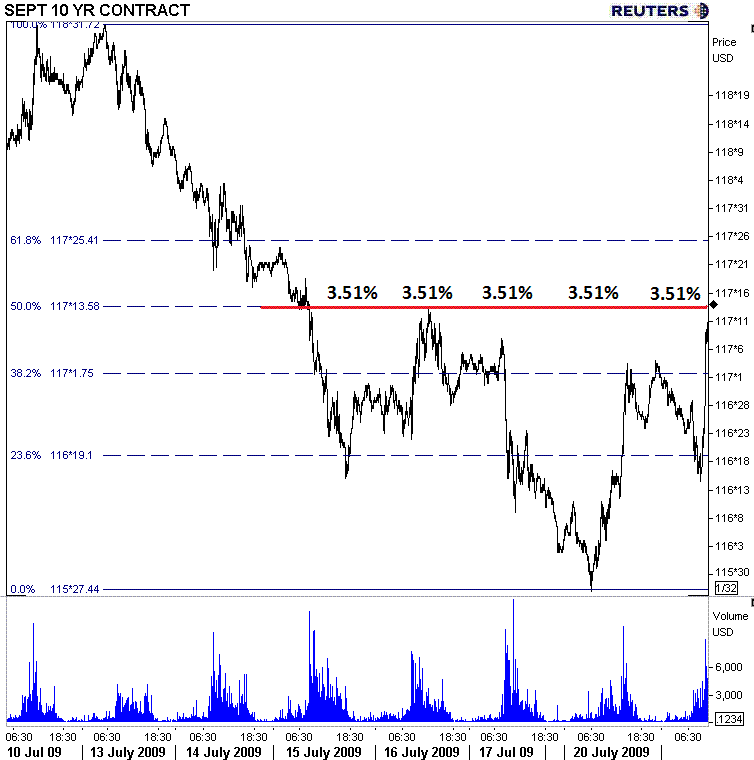
Looking at the rest of the day ....the 10 yr TSY note yield has reached a significant price/yield resistance level. This rally, although has good timing relative to Bernanke speaking (fundamentals), has better technical backing. Lets look at the Sept 10 yr TSY Futures contract....
Yesterday traders broke the 23% retracement and began testing the 38% retracement level (from July price highs...see chart below). After bouncing off overhead resistance at the 38% retracement level (FAIL), traders this morning CONFIRMED that prices over the 23% retracement were acceptable (see bounce higher at 23% retracement this AM). Today, traders blew through the 38% retracement and the 50% retracement (50 is more psychological than technical) and are now looking to test the 62% retracement at 117-25.

Although a nice rally is underway, before getting more excited about lower rates to come we need to see some confirmation that these price levels are acceptable to the market. This implies, if the 10yr contract price moves over 117-16, that prices would have to hold over that level....illustrating the market's acceptance of higher prices and lower yields. If you are watching the cash market (most of you are)...then this would imply we would need to see the 10 yr note yield break through 3.51% and hold below that yield level. This will be a tall task and will likely not occur without traders looking to test the market's acceptance of previous price points.
That assumption can be confirmed when doing "market profile" analysis. We have seen volume taper off as yields plummet and prices rise...so it appears, at the moment, that this leg of the rally is losing momentum as traders will eventually look to test the strength of the two day rally. Furthermore...TSYs have detached themselves from the stock lever...meaning that during this TSY/MBS rally, stocks moving lower have not led TSY prices higher. If stocks start to sell off, then the rally in fixed income could benefit from a risk aversion trade/flight to safety flows into benchmark TSYs. If stocks hold constant at current levels...then this TSY rally will likely stall and price action may get choppy if profit taking begins. Remember this "detachment" from the stock lever occurred yesterday...
Plain and Simple: Traders will most likely push prices lower to confirm the recent wave of bullishness (unless stocks fall). 117-25/3.50 is strong resistance on 10 yr.
Nonetheless, rate sheet influential MBS prices are considerably higher, approaching face melting status, reprices for the better will likely be awarded.


