There are a couple really nice components to point out in today's $13 billion Treasury bond auction.
First of all, perhaps the most commonly referenced metric of "demand"--the bid to cover ratio--came in at 2.74 versus the 10 auction average of 2.66. So right off the bat, we know we're dealing with stronger than normal demand. Add to that the fact that this is the LONG BOND, and suddenly the previously noisy room full of inflation hawks has fallen remarkably silent. The most inflation sensitive bond just put up not only the best numbers of any auction this week, but also much better numbers than it's own historical averages, NOT TO MENTION the fact that overseas accounts were in big according to the "indirect bidders" proxy (which also include hedge funds).
Oh, and it may also bear mentioning that the awarded yield was a whopping 5 basis points lower than 1pm when-issued yield (WI). Our auction breakdown data goes back as far as 2006, but in that data there is not a stronger high yield vs. WI. Here's AQ's killer table that shows all that good stuff:

But now for the info you've all been waiting for... Just what the heck has the effect been on the bond market?
First, by way of stage-setting, please recall the long term 10yr chart I've been working with recently, with what I referred to as "perhaps the most significant internal trendline in the world of interest rates." That line will show up in the next 3 charts. In the first, note that after spending some time below the line, we recently broke back into a channel of higher yields.
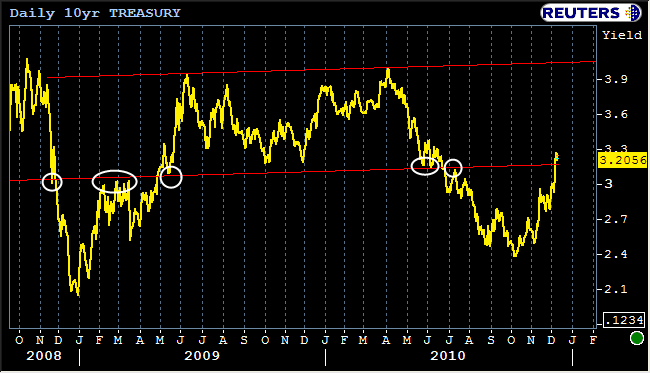
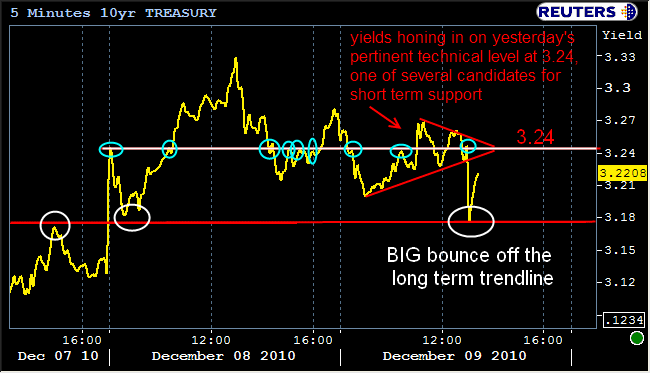
We're still very much testing this break, especially with some grace given for year-end, but today's question would logically be whether or not the auction can take yields back below the line. Short answer: no... Note the rightmost white circle below for evidence. Pretty striking really... So with that big and certainly NOT coincidental bounce, where can we look for SUPPORT (which would be a "ceiling line" with respect to these yield charts). 3.24 was used heavily yesterday, and was pertinent before the auction today as well.
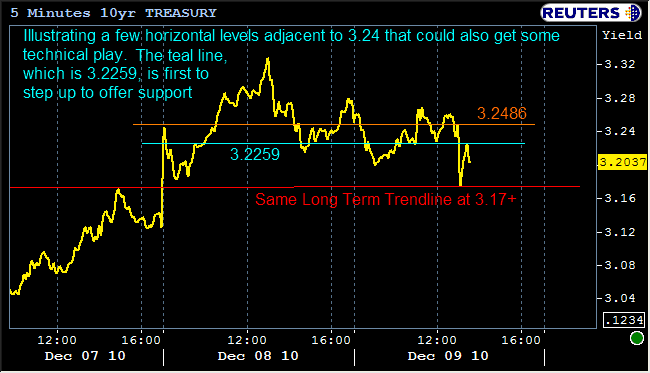
But before making it all the way to 3.24, we've already seen our first show of support at 3.2259. That makes this the line to watch for a repeat performance if yields can't make it through 3.17 (which they probably won't today). Still, with so much chatter in that whole RANGE around 3.24, we could see support at 3.24 itself or 3.2486. It doesn't matter so much which of those levels come into play as long as we don't crack into AM highs around 3.26/27. EVEN THEN, 3.28 is a good candidate for "last line of defense" support, aligning with yesterday afternoon's high yields as well as a pre-auction low yield around 11am.
Stocks also liked the auction. Let's consider what we know about the various instances when we see stocks and bonds rallying in unison. I can think of at least one economic occurrence that results in such rallies: positive news about inflation. Hmmm.... Could be something to that.
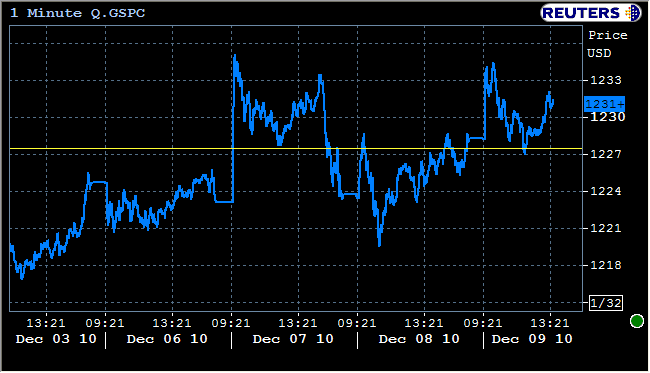
And perhaps just because we've given longer term context in bonds, so too shall we give you some longer term context in stocks. Still not breaking highs from the 7th (bounced there this morning, but auction has not pushed prices back through). The bottom line is that it seems that markets are in the process of forming TRIANGLES all over. Look for a triangle post from me some time soon!
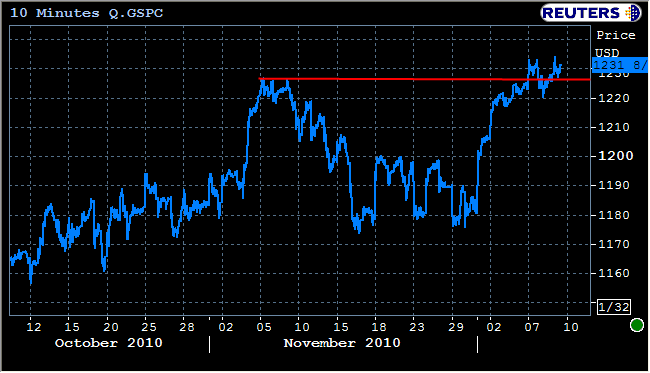
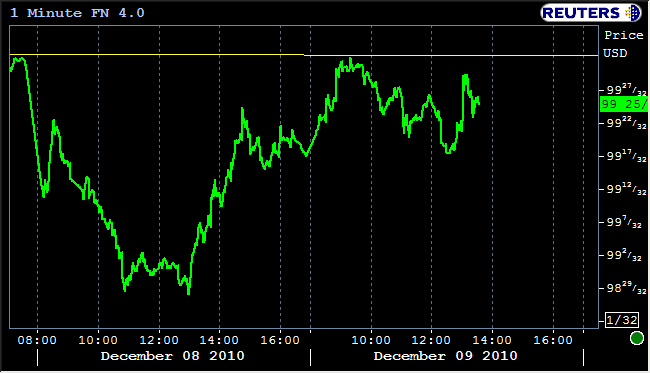
Oh right! Forgot for a moment this is an MBS Commentary! How bout those MBS!? Once again, long term context showing a reentry into long term trend (just like 10yr long term chart).
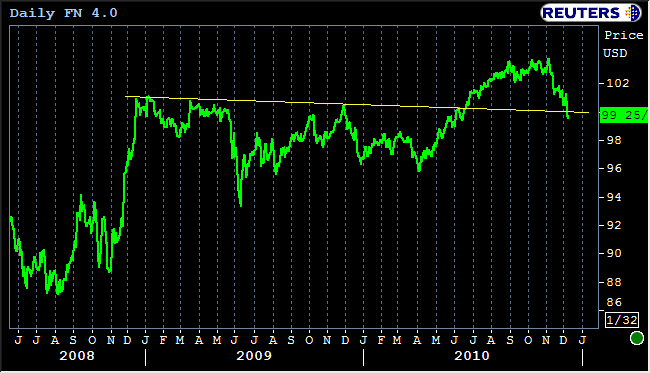
Unlike treasuries though, MBS have not even made it to their long term trendline before meeting resistance. Really not much going on for MBS, as well there should not be! After all, today is "notification day" the prelude to the settlement process for the current crop of Class A MBS that will result in a fresh set of coupons hitting screens next week. Still..we're in better territory than pre-auction which saw MBS trending down. Holding these levels in a short of sideways fashion would be "good enough" for now.
