Here's this morning's alert from MBS Live:
10:42AM: First of all, Happy Veterans Day to you and yours. Bond markets are closed, including MBS, but stocks, futures, and Europe are open. On days like today, with no MBS trading and stocks having free run of the castle, it's about a 50/50 proposition that momentum on those days carries over to the next fully open business day.
If today's momentum does indeed carry over into next week, it looks to be negative for bond markets as stocks are on somewhat of a rampage higher. Meanwhile, 10yr Treasury futures are in line with their very worst levels from yesterday, but volume is understandably low. Another caveat for the stock market is the fact that S&P weakness yesterday had the index testing the lows of it's recent range, so a bounce back from a technical standpoint is logical in that context.
The curveball presented by this particular 3-day weekend for bond markets is the fact that Europe is open for business today and Europe has been the chief market-mover for US markets. So right now, yes, both Europe and the parts of US markets that are open do, in fact, point to a revisit to Thursday's weakest levels. That scary proposition could either get scarier or be mitigated after the completion of today's focal point, an austerity vote in Italy. Indeed, the stock rally is based largely on hopes that the package will be approved by the lower house of of Italy's parliament tomorrow after the Italian Senate approved it today.
---------
Europe has since closed and major averages were up significantly (Dax + 3.22% for instance). That also translated to some hefty gains for S&P's and reasonably hefty losses for Treasury futures. Despite those losses, 10yr futures remained in their recent range, albeit just barely.

Keep in mind that TSY futures trade in price just like MBS. If we were to invert the chart above so that we could compare it to recent movements in 10yr yield (not an exact science, but will give you an approximation), it would look something like this:

But volume in 10yr futures was so low today as to not even matter. Even so, today's market movements would likely point to higher rates on Monday if nothing changed between now and then. That's a big "IF" though... S&P futures' volume was higher by comparison, almost in line with "normal." Stocks basically rallied from the low end of their recent trend channel to the high end:

The chart above shows the lower end of the recent trend channel may be more of a mid-point in a broader trend channel in which stocks have been gradually recovering since August's sell-off. But I'd argue this triangular pattern of converging trends is more appropriate:

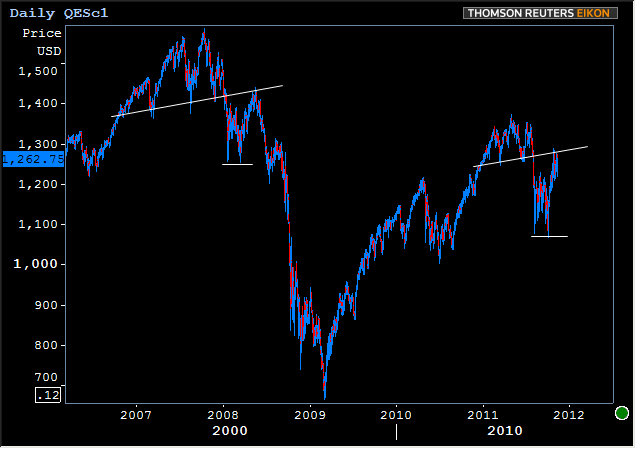
Kind of looks like a "double bottom" in early August and October, followed by a quick rally into an indecisive pattern of consolidation. And the upper limits of that recent trading lie along a line that connects to previous lows that supported the last period of stable market highs in late 2010 and early 2011. Is it just me or does all that stuff kinda maybe sorta seem to apply to another similar moment in time? Stare at this one for a few hours and let me know if I'm off base in pointing out the similarities....


