We've posed this question almost a month ago (read more...) and the answer is fairly similar this time around. That said, MBS prices are higher and more time has passed with the broader rates market trading in a reasonably stable range. These factors (especially the "time passing" part), if they continue, mean that we should indeed expect 3.0 production to continue ramping up.
Fannie 3.5's have been by far and away, the dominant production coupon for conventional loans for several months. This is important because it means that lenders would be going out on too risky a limb by offering any rates lower than those that "fit" into 3.5 coupon buckets. During this time, LLPAs, N/O/O's and the like kept plenty of a market around for 4.0 coupons, not to mention the fact that huge numbers of 4.0 coupon MBS pools are already in existence, meaning there's some point of reference for making a market.
This notion of "market making" is important to the prospect of lower rates. If there aren't enough willing buyers and sellers of 3.0 MBS, it's too risky for lenders to go out on limbs to offer those rates. Especially in the case of 3.5 Fannie 30yr coupons and 3.0 coupons, which were previously unexplored territory. We saw a long slow fight play out in 3.5s starting in mid 2011 which included some TBA-MBS volume, but was also underpinned by lenders offering 3.5-eligible rates that they then simply held in portfolio rather than sell into the TBA market.
This same phenomenon can now be witnessed with 3.0's if you're willing to make an inference or two. It's pretty simple really. If you're seeing lenders offering rates that are too low to fit into 3.5 MBS coupons, then the 3.0 portfolio production is implied (3.625% or lower). When you're seeing this in conjunction with historically high MBS prices, it then becomes a matter of TIME, and a bit of chance, until 3.0 production would start picking up meaningfully in the TBA market. Although you'd see it first based on the "inference" mentioned above, it's now becoming ever-so-slightly perceptible in terms of market-making.
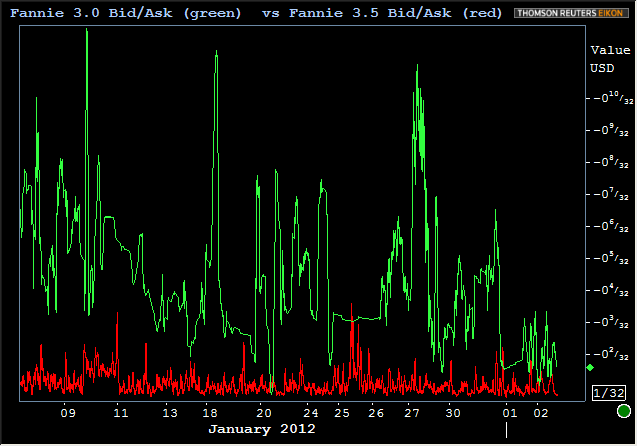
To measure how well-made a market is (i.e. how "liquid"), we can simply look at the difference between what buyers are willing to pay and at what price sellers are willing to sell, aka "bid/ask spreads." To that end, here's a comparison of bid/ask spreads in the healthy 3.5 market vs the not-nearly-as-healthy 3.0 Market. As you can see, there's no reason to consider 3.0's are even remotely similar to 3.5's in terms of liquidity, but this is the sort of thing we can sort of watch from afar to measure how well things are progressing, if they progress. By the time the green line is looking more like the red line, it's much more likely that 3.0 production momentum can be confirmed.

I had a few other charts prepared to discuss, but given the space that's already been occupied, I'll leave the discussion at a minimum and just give you the charts with a sentence each. Let me know if you have any questions on them.
First up, a simple look at the past few days of rallying in MBS (no major significance to yellow lines, just a bit of a consolidating trend until today's breakout:

Perhaps more significance in the long term chart though. 3.5's look to be effectively taking a "lead-off" ahead of tomorrow's NFP. If NFP helps rates stay low or go lower, this would look more and more like a pivot point breakout:

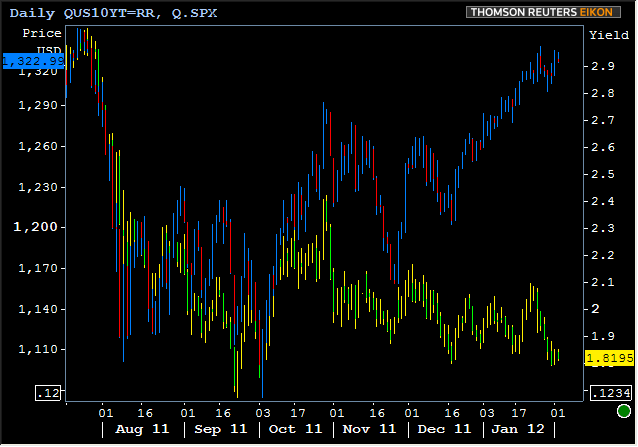
Trading is effectively over for today, and perhaps has been over for the past two days for that matter. Reason being, note the strong connection in the stock-lever. Econ data hasn't moved things much and stocks/bonds are mostly keeping pace with each other, all within a clearly defined range.

Longer term, today's movements are fairly meaningless. Each market was already at or near its recent extremes and has simply been holding there until NFP or some exciting and new from Europe either sends these lines back from whence they came or helps facilitate a breakout.


