Wednesday ended on a positive note for Mortgage-Backed Securities and Treasuries after uneventful economic data in the morning, a reasonable 5yr Note Auction in the afternoon, as well as a bit of a push back against Tuesday's Greek-bailout-inspired positivity (that's "positivity" in a broad economic sense, the kind that favors stocks and tends to hurt bond markets).
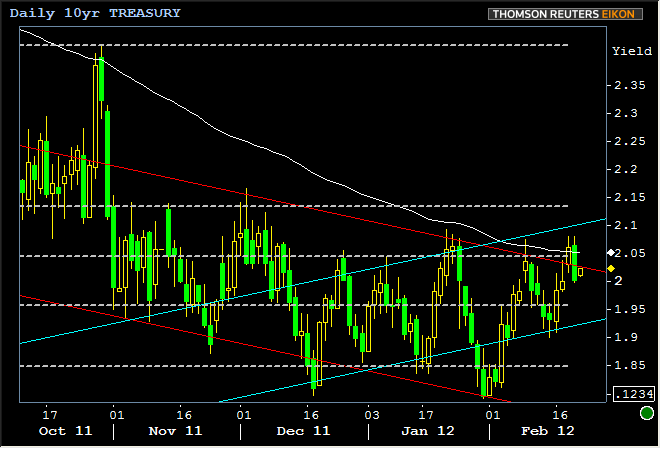
Looking at 10yr Notes as the most usual of suspects when it comes to benchmarking movements of broader bond markets, we see some interesting patterns in the week of trading so far. Early yesterday morning, they backed up to Tuesday's high yields before beginning their somewhat brisk counterattack lower in yield, eventually breaking past 2% later in yesterday's session. The characteristically low volume open of the following day's session at 8pm Eastern time has seen yields trickle a few bps higher to 2.024 by the stroke of midnight, and they've ground sideways there.
The interesting thing about these yields is that they almost perfectly match the high volume lows seen on Tuesday morning, but approach from beneath this time. This is "pivot behavior" (first bouncing on a trendline as resistance, breaking, then bouncing as support), and it's interesting because these low to mid 2.02's lie on the long term trendline that we've been following as signifying the upper limits of a bullish trend in Treasuries. That line is seen in the chart below (upper red line). If it holds as support as volume ramps up today, that would leave an interesting "test/fail" from the previous two sessions, reinforcing the trend channel for now. But it's far too early in the morning to consider such things as anything more than interesting possibilities to watch into the domestic open.

Today's early economic data will likely play a role in determining how close 10's are trading to those 2.02's. Thursday brings the first substantive report of the week as well as the last of the 3 Treasury Note Auctions. Both are important events, but in slightly different ways. The economic data in question is Weekly Jobless Claims--made more interesting this time due to the fact that they coincide with the survey week for the next Non-Farm Payrolls report. The 7yr Note auction at 1pm is important less-so because of it's own cachet and more because it's the last of the week (and month, and kicks off a longer-than-normal number of days without new Treasury supply). To be sure, there is still plenty of risk facing bond markets, but if a few of these market-moving events transpire in our favor, plenty of opportunity as well. European headlines remain a constant possibility to trump all domestic data.
|
Week Of Tue, Feb 21 2012 - Fri, Feb 24 2012 |
||||||
|
Time |
Event |
Period |
Unit |
Forecast |
Prior |
Actual |
|
Tue, Feb 21 |
||||||
|
08:30 |
National Activity Index |
Jan |
-- |
-- |
0.17 |
+0.22 |
|
13:00 |
2-Yr Note Auction |
-- |
bl |
35.0 |
-- |
-- |
|
Wed, Feb 22 |
||||||
|
07:00 |
Mortgage market index |
w/e |
-- |
-- |
801.8 |
766.1 |
|
07:00 |
Mortgage market: change |
w/e |
% |
-- |
-1.0% |
-4.5 |
|
07:00 |
MBA Purchase Index |
w/e |
-- |
-- |
166.6 |
161.8 |
|
07:00 |
Mortgage refinance index |
w/e |
-- |
-- |
4538.0 |
4322.0 |
|
07:00 |
Refinancing: change |
w/e |
% |
-- |
0.8% |
-4.8 |
|
07:00 |
MBA Purchase: change |
w/e |
% |
-- |
-8.4% |
-2.9 |
|
07:00 |
MBA 30-yr mortgage rate |
w/e |
% |
-- |
4.08% |
4.09 |
|
10:00 |
Existing home sales |
Jan |
ml |
4.65 |
4.61 |
4.57 |
|
10:00 |
Exist. home sales % chg |
Jan |
% |
1.9% |
5.0% |
+4.3 |
|
13:00 |
5-Yr Note Auction |
-- |
bl |
35.0 |
-- |
-- |
|
Thu, Feb 23 |
||||||
|
08:30 |
Initial Jobless Claims |
w/e |
k |
354 |
348 |
-- |
|
08:30 |
Continued jobless claims |
w/e |
ml |
3.46 |
3.426 |
-- |
|
10:00 |
Monthly Home Price mm |
Dec |
% |
-- |
1.0% |
-- |
|
10:00 |
Monthly Home Price yy |
Dec |
% |
-- |
-1.8% |
-- |
|
11:00 |
KC Fed manufacturing |
Feb |
-- |
-- |
13% |
-- |
|
13:00 |
7-Yr Note Auction |
-- |
bl |
29.0 |
-- |
-- |
|
Fri, Feb 24 |
||||||
|
09:55 |
U.Mich sentiment |
Feb |
-- |
73.0 |
72.5 |
-- |
|
09:55 |
U Mich conditions |
Feb |
-- |
80.3 |
79.6 |
-- |
|
09:55 |
U.Mich expectation |
Feb |
-- |
68.5 |
68.0 |
-- |
|
10:00 |
New home sales-units mm |
Jan |
ml |
.315 |
.307 |
-- |
|
10:00 |
New home sales chg mm |
Jan |
% |
2.6% |
-- |
-- |


