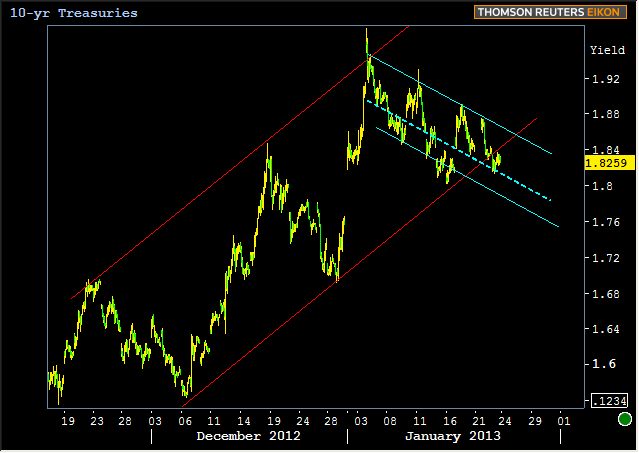
Last Thursday was the worst day for bond markets since the first trading day of 2013, when markets were reacting to Fiscal Cliff developments after a long holiday weekend. For several reasons, last Thursday was the more disconcerting sell-off. There was no argument for any "pent-up" trading momentum, as could have been made for the first day of a new year after receiving hotly anticipated news. Market participation was infinitely more robust, and finally, the motivations for the sell-off included the two dominant forces in the era of sub 2% 10yr yields: Europe and The Fed.
If we're talking about Jobless Claims, why mention Europe and the Fed? First of all, let's get Europe out of the way. Last Thursday's sell-off can't be properly considered without acknowledging that much of the upward pressure on rates was due to the ECB announcement and press conference, the latter conveniently beginning at the same time Jobless Claims reported. German debt got hit harder than US debt (a phenomenon that continues to play out in general in the new year, but was particularly pronounced last week).

With that out of the way, what's all this about the Fed? In short, it's the same old spiel about employment data as a proxy for Fed policy. Given that Fed policy and Europe are the two key drivers of record low rates in 2012, and given the fact that the Fed has now flat-out wedged unemployment thresholds into the official policy statement, employment data becomes hugely important again, just like it was in the months and weeks that preceded QE3. At that time we were extra interested in Fed speaker anecdotes that hinted at the probability of QE3 based on the following famous passage from August's FOMC Minutes:
"Many members judged that additional monetary accommodation would likely be warranted fairly soon unless incoming information pointed to a substantial and sustainable strengthening in the pace of the economic recovery."
(08/23/12 Commentary with more analysis on the Fed's game-changer)
History is a good lesson here... The FOMC Minutes showed the Fed's cards and the Fed played them as expected. In the current case, we don't necessarily have the most recent FOMC Minutes hinting at anything in particular, but having the actual threshold in the official policy statement is a more potent indication that the Fed will keep it's promise of slowly but surely curtailing QE's when unemployment gets low enough. Bottom line, it's not that last week's Jobless Claims were low enough to convince anyone the economy was soon destined for greatness, but rather, they were low enough to raise the risk that February's NFP could end up looking like an incremental step toward the abatement of quantitative easing.
Ergo, Jobless Claims are interesting today... There are also the various Markit Manufacturing PMI's beginning in Europe overnight, but these would have to miss fairly big in order to stimulate much market movement. Left to their own devices, bond markets--especially domestic bond markets--look to be favoring "containment" after the run-up to multi-month high yields at the start of the year, fighting off a bullish earnings season in equities markets and the weakness in European bond markets (which is a bit of a drag on domestic bond markets). Despite the headwinds, 10yr yields are just edging outside the 2-month uptrend and breaking the 21-day moving average (white line):

Here are the same trendlines (intermediate term channel in red and short term channel in teal), but zoomed to an HOURLY view (vs DAILY in the previous chart). The hourly chart brings a new internal trendline to light, giving us something to gauge this little foray outside the safe and familiar confines of the slow-motion sell-off over the past two months. It's early yet, to be hoping the "little teal trend" will put up a meaningful fight against "big red," but we'll keep an eye on it and a finger or two crossed.

MBS need more help... We're not yet challenging the two month downtrend in prices (equivalent to uptrend in Treasury yields), but at least we're getting close. QE3 horizontal technical levels are inserted below just for the hell of it. For what it's worth, we've only closed above the pre QE3 highs one time in 2013 (but right on top of them 4 times).

|
Week Of Mon, Jan 22 2012 - Fri, Jan 25 2012 |
|||||
|
Time |
Event |
Period |
Unit |
Forecast |
Prior |
|
Tue, Jan 22 |
|||||
|
10:00 |
Existing home sales |
Dec |
ml |
5.08 |
5.04 |
|
10:00 |
Exist. home sales % chg |
Dec |
% |
0.6 |
5.9 |
|
Wed, Jan 23 |
|||||
|
07:00 |
Mortgage refinance index |
w/e |
-- |
-- |
4563.7 |
|
07:00 |
Mortgage market index |
w/e |
-- |
-- |
836.5 |
|
09:00 |
Monthly Home Price mm |
Nov |
% |
-- |
0.5 |
|
Thu, Jan 24 |
|||||
|
08:30 |
Initial Jobless Claims |
w/e |
K |
355k |
335k |
|
08:58 |
Markit Manufacturing PMI |
Jan |
-- |
53.0 |
54.0 |
|
Fri, Jan 25 |
|||||
|
10:00 |
New Home Sales |
Dec |
Mln |
.385 |
.377 |
|
* mm: monthly | yy: annual | qq: quarterly | "w/e" in "period" column indicates a weekly report * Q1: First Quarter | Adv: Advance Release | Pre: Preliminary Release | Fin: Final Release * (n)SA: (non) Seasonally Adjusted * PMI: "Purchasing Managers Index" |
|||||


