Wednesday was relatively brutal in that it marked the first major push below 103-00 for Fannie 3.0s since... Well... since the only other time Fannie 3.0s have ever fallen below 103-00 (Granted, they moved to 102-30 by yesterday's 5pm close, but spend the "liquid hours" exclusively over 103, and surely we can forgive a mere 2 tick break. But Wednesday's break actually shows up on long term charts:

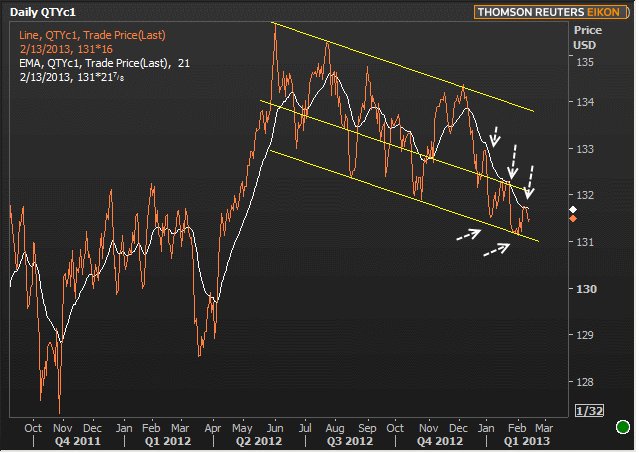
That chart and that pattern of prices is vaguely reminiscent of yesterday morning's chart of 10yr Futures Prices (keep in mind, these are PRICES, so the higher the orange line, the lower the 10yr yield is moving). Here's the chart:

And here's what we said about that chart: "Notice prices grinding into the longer term trendline, pushed down for 2 months exclusively under the 21-day moving average (that doesn't happen much... last time was late 2010). Tuesday showed us that there's plenty of room to play around between the moving average and the longer term support (lower yellow line), but a break higher or lower is increasingly likely."
Updating that chart to include Wednesday's price action and we see that "plenty of room to play around" is already exhausted by the sharp-ish sell-off.

Thus, "a break higher or lower" is even MORE likely in the coming days. This morning's Jobless Claims numbers are from the same week that the survey for next month's NFP numbers is being conducted. As such, a big miss or beat could be seen as more meaningful. Markets are planning on a middle-of-the-road 360k reading. The afternoon will see the conclusion of this week's auction cycle with 30yr Bonds at 1pm. Yesterday's 10's caused moderate indigestion, but the auction itself was acceptably sub-par. 30's tend to have a tough time during refunding cycles and we basically need this one to "not have a tough time' in order to avoid breaking the wrong side of of the chart. Either that or Jobless Claims need to set a strong tone in the morning. Then again, Europe has been setting the tone in the morning of late (Japan rapidly becoming important as well, but not for European-style reasons), so yeah... Wild cards abound.
|
Week Of Mon, Feb 11 2013 - Fri, Feb 15 2013 |
|||||
|
Time |
Event |
Period |
Unit |
Forecast |
Prior |
|
Mon, Feb 11 |
|||||
|
-- |
No Significant Data Scheduled |
-- |
-- |
-- |
-- |
|
Tue, Feb 12 |
|||||
|
13:00 |
3-Yr Note Auction |
-- |
bl |
32.0 |
-- |
|
14:00 |
Federal budget, $ |
Jan |
bl |
-21.00 |
-0.26 |
|
Wed, Feb 13 |
|||||
|
07:00 |
Mortgage market index |
w/e |
-- |
-- |
849.8 |
|
08:30 |
Import/Export Prices |
Jan |
% |
0.7 |
-0.1 |
|
08:30 |
Retail Sales |
Jan |
% |
0.1 |
0.5 |
|
10:00 |
Business Inventories |
Dec |
% |
0.3 |
0.3 |
|
13:00 |
10yr Note Auction |
-- |
bl |
24.0 |
-- |
|
Thu, Feb 14 |
|||||
|
08:30 |
Initial Jobless Claims |
w/e |
k |
360 |
366 |
|
13:00 |
30-Yr Treasury Auction |
-- |
bl |
16.0 |
-- |
|
Fri, Feb 15 |
|||||
|
08:30 |
NY Fed manufacturing |
Feb |
-- |
-2.50 |
-7.78 |
|
09:15 |
Industrial Production |
Jan |
% |
0.2 |
0.3 |
|
09:15 |
Capacity utilization mm |
Jan |
% |
78.9 |
78.8 |
|
09:55 |
Consumer Sentiment |
Feb |
-- |
74.2 |
73.8 |
|
* mm: monthly | yy: annual | qq: quarterly | "w/e" in "period" column indicates a weekly report * Q1: First Quarter | Adv: Advance Release | Pre: Preliminary Release | Fin: Final Release * (n)SA: (non) Seasonally Adjusted * PMI: "Purchasing Managers Index" |
|||||


