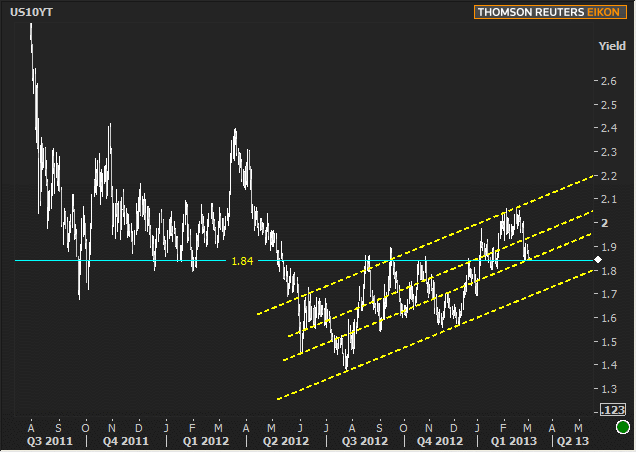
This week serves as something of a crossroads for bond markets with respect to the longer term move higher in yields that began in the summer of 2012. Within the broader trend, there have been shorter, steeper moves higher and lower with the clearest example of this having occurred in the form of the weakness that began in mid-December. That move higher in rates was finally broken last Monday after the Italian election results reminded global markets about past failures of EU countries to "form governments" and the flight-to-safety bond-buying that ensued.
In spite of the bounce back, rates haven't yet made it clear whether they'll make a run at the longer term resistance levels or even if they'll be able to challenge important pivot points such as 1.84 in 10yr Treasuries. The following chart contains that 1.84 level--something we discussed last week as a sort of dividing line between the first and second stages of the "new era" of low rates that began in mid 2011--as well as the broadest long term trend higher in rates.

The takeaway from the chart is that rates certainly did something different last week and are in a relatively more nimble position this week. Not only have they moved into the central zone of the long-term trend, but they're also right on that dividing line between the upper and lower sections of the "new era." It's not always the case that this sort of "return to nimbleness" suggests an increased focus on impending headline events, but at least we can conclude that, if this is the case, we know what the events probably are: the ECB Announcement on Thursday and the Employment Situation on Friday.
Between now and Thursday, the calendar is quite limited, with essentially nothing happening on Monday (ISM New York isn't much of a market mover) and the national ISM Non-Manufacturing data on Tuesday (more of a market mover, but not compared to the Employment data). Wednesday is a bit of a wild card as markets historically reserve the right to react to any substantial deviations from expectations on the ADP Private Payrolls data, but the focal points of the week remain on Thursday and Friday morning with the ECB and NFP respectively.
|
Week Of Mon, Mar 4 2013 - Fri, Mar 8 2013 |
|||||
|
Time |
Event |
Period |
Unit |
Forecast |
Prior |
|
Mon, Mar 4 |
|||||
|
09:45 |
ISM-New York index |
Feb |
-- |
-- |
568.3 |
|
Tue, Mar 5 |
|||||
|
10:00 |
ISM N-Mfg PMI |
Feb |
-- |
55.0 |
55.2 |
|
10:00 |
ISM N-Mfg Bus Act |
Feb |
-- |
55.8 |
56.4 |
|
Wed, Mar 6 |
|||||
|
07:00 |
Mortgage market index |
w/e |
-- |
-- |
753.0 |
|
07:00 |
Mortgage refinance index |
w/e |
-- |
-- |
4105.8 |
|
08:15 |
ADP National Employment |
Feb |
k |
169 |
192 |
|
10:00 |
Factory orders mm |
Jan |
% |
-2.2 |
1.8 |
|
Thu, Mar 7 |
|||||
|
07:30 |
Challenger layoffs |
Feb |
k |
-- |
40.4 |
|
08:30 |
Initial Jobless Claims |
w/e |
K |
355 |
344 |
|
08:30 |
Productivity Revised |
Q4 |
% |
-1.6 |
-2.0 |
|
08:30 |
International trade mm $ |
Jan |
bl |
-43.0 |
-38.5 |
|
08:30 |
Productivity and Costs |
Q4 |
% |
-1.6 |
-2.0 |
|
Fri, Mar 8 |
|||||
|
08:30 |
Non-farm payrolls |
Feb |
k |
160 |
157 |
|
08:30 |
Private Payrolls |
Feb |
k |
170 |
166 |
|
08:30 |
Average workweek hrs |
Feb |
hr |
34.4 |
34.4 |
|
08:30 |
Unemployment rate mm |
Feb |
% |
7.9 |
7.9 |
|
08:30 |
Average earnings mm |
Feb |
% |
0.2 |
0.2 |
|
10:00 |
Wholesale inventories mm |
Jan |
% |
0.3 |
-0.1 |
|
10:00 |
Wholesale sales mm |
Jan |
% |
0.3 |
0.0 |
|
* mm: monthly | yy: annual | qq: quarterly | "w/e" in "period" column indicates a weekly report * Q1: First Quarter | Adv: Advance Release | Pre: Preliminary Release | Fin: Final Release * (n)SA: (non) Seasonally Adjusted * PMI: "Purchasing Managers Index" |
|||||


