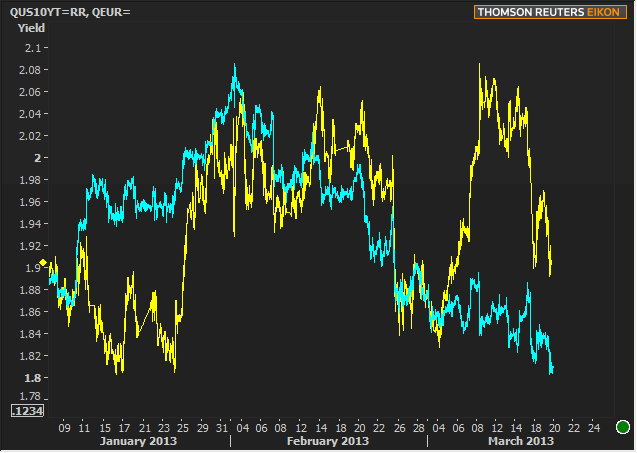
Another day, another chance to sit and wait for every little headline even remotely related to Europe and to assess whether or not it suggests a change in trading all while watching everyone else do the same. That's been about the size of it for bond markets over the past 2 days, and indeed this tends to be the case any time that European headlines get particularly shocking and nasty. This doesn't necessarily hearken the end of the world, but it does make the journey a bit bumpy and unpredictable between now and then. To illustrate this phenomenon of European headlines "seizing control" of US bond markets, here's a "before" shot of US 10's vs the Euro over the past 3 months. They've definitely been willing to go their separate ways:

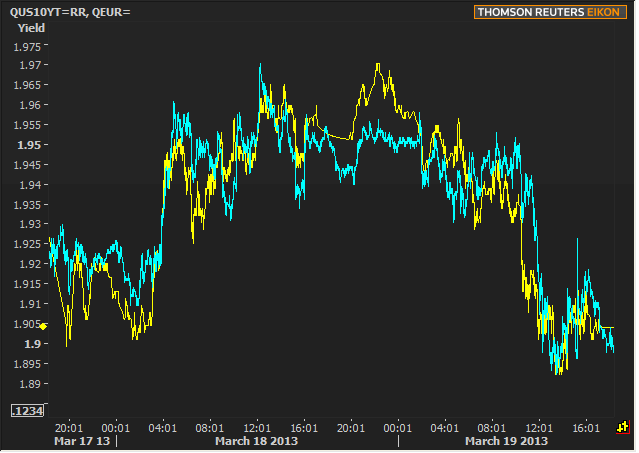
And here are the same two securities charted only over the past 2 days:

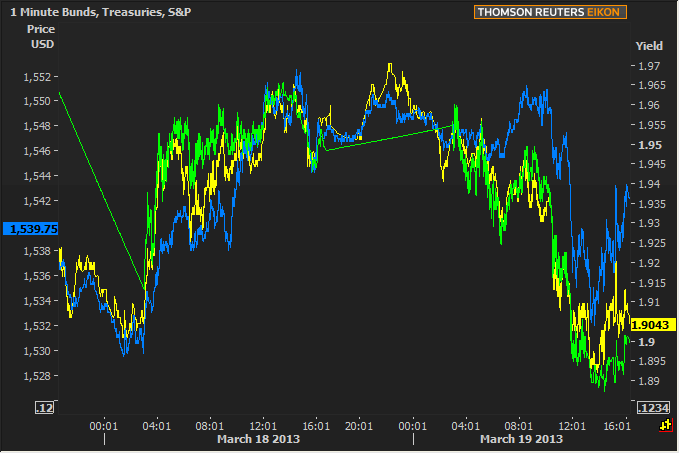
Not a perfect correlation, but a marked change nonetheless. In fact, most players in the global economic marching band tend to head toward the sides of the road and watch the parade of headlines, doing their best to play along. Here are Bunds, Treasuries, and S&P Futures.

No one want's to rock the boat too terribly much. That's all well and good so far this week as nothing else suggests itself as a center of attention. But now we have the trio of FOMC Festivities (Announcement, Forecasts, Press Conference) to contend with. We're not expecting any salient changes in the official text, and not much of an evolution in outlook from Bernanke, so the focus may fall on the extent to which Members revise their forecasts in light of recent economic data. Of particular importance will be the employment outlooks. It's important to note that this is the first batch of forecasts we've gotten since the FOMC Minutes shifted in tone on January 3rd. Also of particular importance is how the following trends evolve:

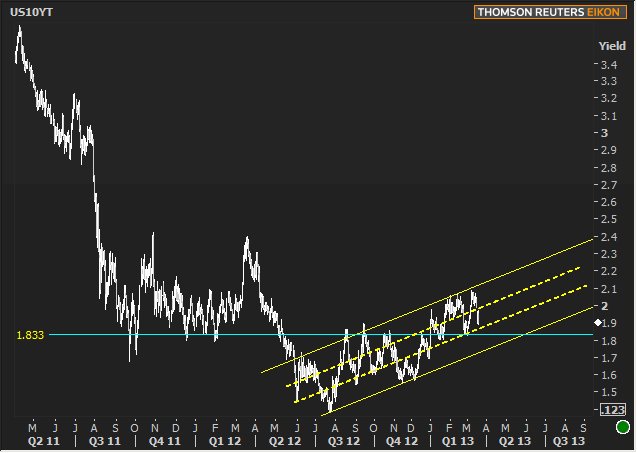
This is the same old trend channel that we keep coming back to for several months with the epic 1.84 zone separating the two modern era's of 10yr range (1.833 happened to be where the line fell in the chart, but the zone from 1.82-1.85 is in play). Cyprus has certainly helped yields lower, but we've got some work to do if we're going to "defeat" this slow grind higher in rate.
|
Week Of Mon, Mar 18 2013 - Fri, Mar 22 2013 |
|||||
|
Time |
Event |
Period |
Unit |
Forecast |
Prior |
|
Mon, Mar 18 |
|||||
|
10:00 |
NAHB housing market indx |
Mar |
-- |
48 |
46 |
|
Tue, Mar 19 |
|||||
|
08:30 |
Housing starts number mm |
Feb |
ml |
0.920 |
0.890 |
|
08:30 |
House starts mm: change |
Feb |
% |
-- |
-8.5 |
|
08:30 |
Build permits: change mm |
Feb |
% |
-- |
-0.6 |
|
08:30 |
Building permits: number |
Feb |
ml |
0.928 |
0.904 |
|
Wed, Mar 20 |
|||||
|
07:00 |
Mortgage market index |
w/e |
-- |
-- |
823.7 |
|
07:00 |
Mortgage refinance index |
w/e |
-- |
-- |
4466.8 |
|
12:30 |
FOMC Announcement |
N/A |
% |
-- |
-- |
|
14:00 |
FOMC Member Forecasts |
N/A |
% |
-- |
-- |
|
14:15 |
FOMC Chairman Press Conference |
N/A |
-- |
-- |
-- |
|
Thu, Mar 21 |
|||||
|
08:30 |
Initial Jobless Claims |
w/e |
K |
345 |
332 |
|
08:58 |
Markit Manufacturing PMI |
Mar |
-- |
55.0 |
54.3 |
|
09:00 |
Monthly Home Price mm |
Jan |
% |
-- |
0.6 |
|
10:00 |
Leading index chg mm |
Feb |
% |
0.3 |
0.2 |
|
10:00 |
Philly Fed Business Index |
Mar |
-- |
-2.0 |
-12.5 |
|
10:00 |
Exist. home sales % chg |
Feb |
% |
2.1 |
0.4 |
|
10:00 |
Existing home sales |
Feb |
ml |
5.00 |
4.92 |
|
13:00 |
10yr Treasury Auction |
-- |
bl |
13.0 |
-- |
|
* mm: monthly | yy: annual | qq: quarterly | "w/e" in "period" column indicates a weekly report * Q1: First Quarter | Adv: Advance Release | Pre: Preliminary Release | Fin: Final Release * (n)SA: (non) Seasonally Adjusted * PMI: "Purchasing Managers Index" |
|||||


