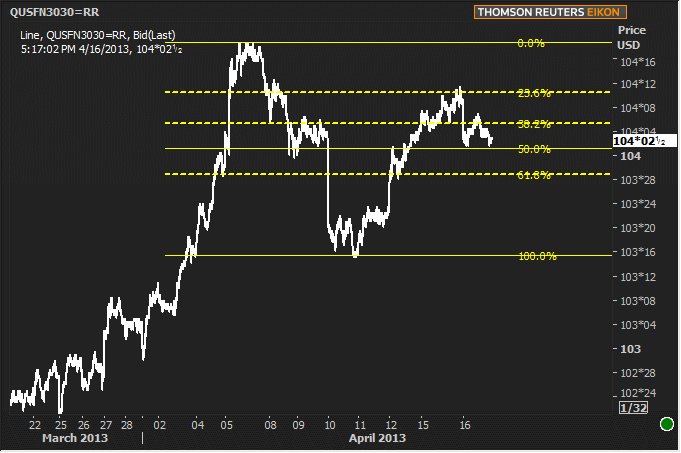
For both MBS and Treasuries, the sense of "resistance" has been building for several sessions--"technical resistance" to be specific. This terminology is specifically chosen because of the recurring price (and yield) levels that have informed trading direction more than the fundamental data ("technical" vs "fundamental" is a popular dichotomy of financial markets, with the former perceived to only concern itself with trading levels and the application of "cool math" to them, while the latter concerns itself purely with "what's happening" in terms of news, data, earnings, etc..). In reality, any good technician or fundamentalist must borrow from the ostensibly opposed school of thought, resulting in a more "Yin and Yang" relationship.
And so it is that we find ourselves this week both with fundamental resistance to rallying back through recently bullish levels (no string of mega important, mega bad employment data culminating in NFP Friday, and recurring resistance levels on the charts). The fundamental picture doesn't offer a lot of justification for bond markets to move far in either direction at the moment, and the technical framework supports that--going one step further by offering lines in the sand with which we can benchmark the lack of motivation. Here's a look at those lines in the sand courtesy of Fibonacci and MBS:

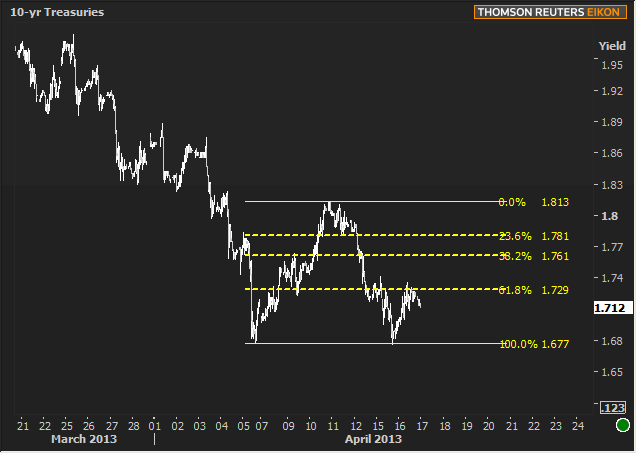
Same Fibonacci sequence and same time frame in 10yr Treasuries (I removed the 50% line because it's not as cool as the 62% and 38% lines, not to mention that the 1.73 level deserves emphasis):

Perhaps the preceding chart is the best look at the "resistance" which, in the case of 10yr Treasury yields, is a "floor" at 1.678. From here, 10's could move to retest that floor, or begin taking out the various technical ceilings overhead (those are the "lines in the sand" that help us gauge how the consolidation is shaping up. So far, resistance is intact. We're guarded against this possibility because of the longer term chart:

All that having been said, a stronger showing today--if we can manage one--would go some way toward softening the perception that resistance will create a hard bounce higher in yield (or lower in price for MBS). It's a good trading day for markets to show us some of their hidden technical motivations as there's not much else to go on. The only morning data is the non-market-moving MBA Mortgage Applications. The Fed's Beige Book is released in the afternoon, but is also not typically a market mover.
|
Week Of Mon, Apr 15 2013 - Fri, Apr 19 2013 |
|||||
|
Time |
Event |
Period |
Unit |
Forecast |
Prior |
|
Mon, Apr 15 |
|||||
|
08:30 |
NY Fed manufacturing |
Apr |
-- |
7.0 |
9.24 |
|
09:00 |
Net L-T flows,exswaps |
Feb |
bl |
40.0 |
25.7 |
|
10:00 |
NAHB housing market indx |
Apr |
-- |
45 |
44 |
|
Tue, Apr 16 |
|||||
|
08:30 |
CPI mm, sa |
Mar |
% |
0.0 |
0.7 |
|
08:30 |
Core CPI mm, sa |
Mar |
% |
0.2 |
0.2 |
|
08:30 |
Housing starts number mm |
Mar |
ml |
0.930 |
0.917 |
|
08:30 |
Building permits: number |
Mar |
ml |
0.940 |
0.939 |
|
09:15 |
Industrial output mm |
Mar |
% |
0.3 |
0.8 |
|
09:15 |
Capacity utilization mm |
Mar |
% |
78.4 |
78.3 |
|
Wed, Apr 17 |
|||||
|
07:00 |
Mortgage market index |
w/e |
-- |
-- |
826.1 |
|
07:00 |
Mortgage refinance index |
w/e |
-- |
-- |
4453.9 |
|
07:00 |
MBA Purchase Index |
w/e |
-- |
-- |
209.7 |
|
07:00 |
MBA 30-yr mortgage rate |
w/e |
% |
-- |
3.68 |
|
Thu, Apr 18 |
|||||
|
08:30 |
Initial Jobless Claims |
w/e |
K |
350 |
346 |
|
10:00 |
Philly Fed Business Index |
Apr |
-- |
3.0 |
2.0 |
|
13:00 |
5yr Treasury Auction |
-- |
bl |
18.0 |
-- |
|
* mm: monthly | yy: annual | qq: quarterly | "w/e" in "period" column indicates a weekly report * Q1: First Quarter | Adv: Advance Release | Pre: Preliminary Release | Fin: Final Release * (n)SA: (non) Seasonally Adjusted * PMI: "Purchasing Managers Index" |
|||||


