After an eerily uncommon two days in a row of gains, bond markets will face off with an old friend: 'month-end.' This tends to be a supportive time of month for Treasuries and MBS as portfolio managers must match their holdings to recently updated indices. Simply put, month-end means some additional buying needs arise in bond markets.
The problem is that market participants already know this and already know the values by which the indices have extended, so it's not as if there's a small window of time on the last day of the month itself. Combine that with the recent uncertainty entering fixed income and there's some reason to doubt that we'd have automatically supportive price action.
Regardless of month-end, we're in the process of tentatively feeling out the most likely trading range and bias heading into next week's NFP on Friday. That's a long way away to be sure, but Tuesday's swings were big enough to provide potential starting points for that range. It's up to the intervening days to determine how it will evolve (i.e. sideways, consolidating, or trending).
Today's data could play more of a role than month-end. The highest degree of correlation as far as charts are concerned is actually in Consumer Sentiment, despite Chicago PMI and Incomes/Outlays having moderate street cred as market movers. Here's how sentiment has shaped up vs stocks and Treasuries over time:

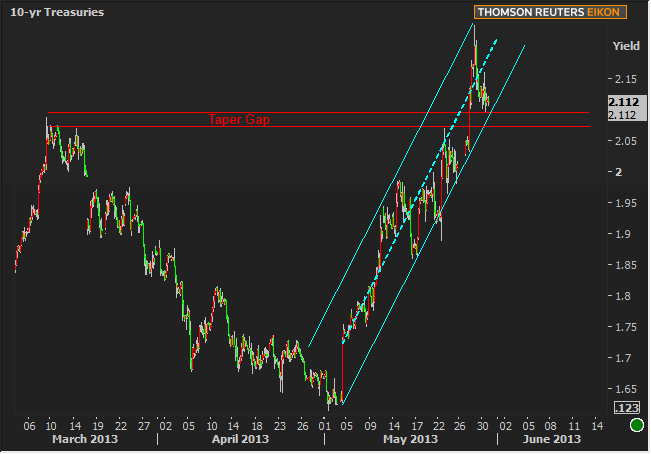
From a purely technical standpoint (when you see "purely technical standpoint," imagine that that we shut off all inbound news, data, emails, phone lines, tweets, etc., and markets are simply left with trading levels as guidance for new trading levels), Treasuries seem like they will have a tough time moving back through the gap in yields between the last two Wednesdays ("taper gap" below). The uptrend (in teal) might be an easier thing to contend with, but could also pose problems if the data aligns against us. To be clear, I think the technical landscape poses challenges, but data may override those challenges if it's friendly enough.

|
Week Of Mon, May 27 2013 - Fri, May 31 2013 |
|||||
|
Time |
Event |
Period |
Unit |
Forecast |
Prior |
|
Tue, May 28 |
|||||
|
09:00 |
Case Shiller Home Prices |
Mar |
% |
0.7 |
0.3 |
|
10:00 |
Consumer confidence |
May |
-- |
71.0 |
68.1 |
|
13:00 |
2-Yr Note Auction |
-- |
bl |
35.0 |
-- |
|
Wed, May 29 |
|||||
|
07:00 |
MBA Mortgage market index |
w/e |
-- |
-- |
791.0 |
|
13:00 |
5yr Treasury Auction |
-- |
bl |
35.0 |
-- |
|
Thu, May 30 |
|||||
|
08:30 |
GDP Final |
Q1 |
% |
2.5 |
2.5 |
|
08:30 |
Initial Jobless Claims |
w/e |
k |
340 |
340 |
|
10:00 |
Pending sales change mm |
Apr |
% |
1.0 |
1.5 |
|
13:00 |
7-Yr Note Auction |
-- |
bl |
29.0 |
-- |
|
Fri, May 31 |
|||||
|
08:30 |
Personal Consumption (Outlays) |
Apr |
% |
0.1 |
0.2 |
|
08:30 |
Personal income |
Apr |
% |
0.1 |
0.2 |
|
09:45 |
Chicago PMI |
May |
-- |
50.0 |
49.0 |
|
09:55 |
U.Mich sentiment |
May |
-- |
83.7 |
83.7 |
|
* mm: monthly | yy: annual | qq: quarterly | "w/e" in "period" column indicates a weekly report * Q1: First Quarter | Adv: Advance Release | Pre: Preliminary Release | Fin: Final Release * (n)SA: (non) Seasonally Adjusted * PMI: "Purchasing Managers Index" |
|||||


