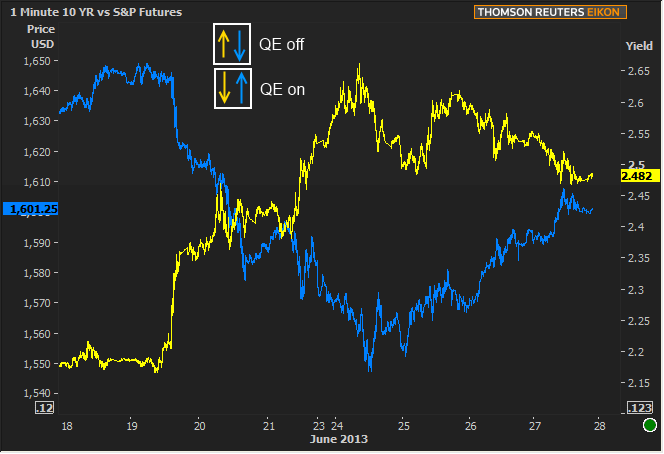
If market participants were into trading cards, the flavor of the month would certainly be "cue cards." These are the things you need when you're not quite sure what to say, right? But in the financial market's version of the game, the cards are actually "QE Cue" cards, typically held up by various Fed speakers and read almost exactly the same way by stocks and bonds alike. In other words, when Fed-speak leads markets to conclude that QE is at less risk of tapering, bond yields drop and stock prices rise. That's been the more frequently the case of late, as opposed to the obvious movement after last week's FOMC where stock prices swung lower and bond yields spiked. As we've noted, it's made for a bit of Rorshach test effect when the charts are overlaid. Sort of mesmerizing:

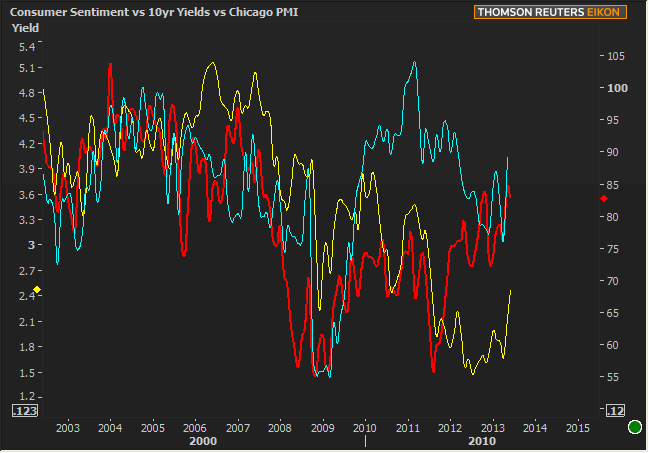
It's not only Fed-speak that has this effect, but indeed the data itself has been extrapolated into the same QE cues (where a weaker than expected GDP print actually results in a stock rally as it's more in line with ongoing QE). To that end, there will be two potentially market moving reports out today: Chicago PMI and Consumer Sentiment. Here's a random chart with both of those reports overlaid with 10yr yields (sentiment in RED, PMI in TEAL, and 10's in YELLOW. No particular conclusion here, except that maybe QE has artificially depressed yields, and now that we're talking about tapering, yields are returning to the flock--maybe).

Despite those bigger picture "maybes," either of these reports would have to bring their "A" game if they hope to hold up the mighty QE cue cards. Reason being: it's month/quarter-end where a large portion of the trading community has to be holding a certain amount of a certain blend of securities by the time they mark their books for the day (usually 3pm for bond markets). This doesn't have any major significance in terms of being a rally or sell-off waiting to happen, but it can create weird trading momentum that acts of its own volition without regard to other motivations. The major caveat about the economic data is that Chicago PMI can cause a big swing at 9:42am even though it's officially out at 9:45am because it's released early to subscribers.
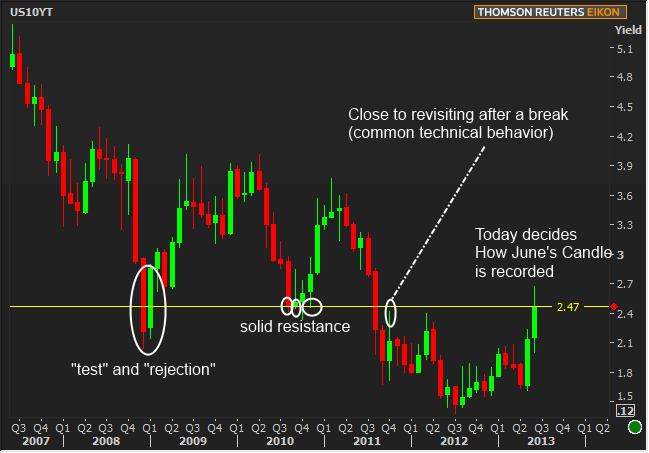
In the spirit of "month-end," let's take a look at the prize that Treasury yields will be playing for: a closing mark under this somewhat epic 2.47 level that they seemed to find impossible to break below yesterday. here's how it looks in the long term:

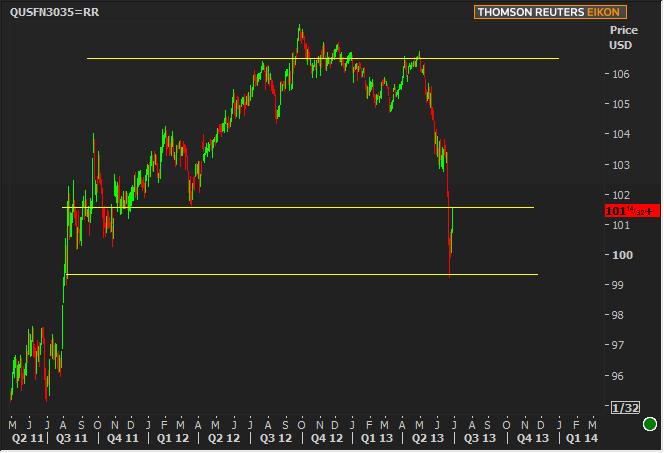
And not to be left out, here's an obligatory chart of Fannie 3.5s, which kicked butt yesterday even as 10's stuggled to make new lows after running into 2.47. MBS earned back well over a quarter of the sell-off so far this week, and HALF the post-FOMC sell-off. Jolly good show! Here's hoping the retracement continues.

|
Week Of Mon, Jun 23 2013 - Fri, Jun 27 2013 |
|||||
|
Time |
Event |
Period |
Unit |
Forecast |
Prior |
|
Mon, Jun 24 |
|||||
|
08:30 |
National Activity Index |
May |
-- |
-- |
-0.53 |
|
Tue, Jun 25 |
|||||
|
08:30 |
Durable Goods |
May |
% |
3.0 |
3.5 |
|
09:00 |
FHFA Home Price mm |
Apr |
% |
-- |
1.3 |
|
09:00 |
Case Shiller Home Prices |
Apr |
% |
1.2 |
1.4 |
|
10:00 |
New home sales-units mm |
May |
ml |
0.463 |
0.454 |
|
10:00 |
Consumer confidence |
Jun |
-- |
75.5 |
76.2 |
|
13:00 |
2-Yr Note Auction |
-- |
bl |
35.0 |
-- |
|
Wed, Jun 26 |
|||||
|
07:00 |
MBA Mortgage market index |
w/e |
-- |
-- |
648.9 |
|
07:00 |
MBA 30-yr mortgage rate |
w/e |
% |
-- |
4.17 |
|
08:30 |
GDP Final |
Q1 |
% |
2.4 |
2.4 |
|
08:30 |
GDP deflator Final |
Q1 |
% |
1.1 |
1.2 |
|
13:00 |
5yr Treasury Auction |
-- |
bl |
35.0 |
-- |
|
Thu, Jun 27 |
|||||
|
08:30 |
Midwest manufacturing |
May |
-- |
-- |
95.9 |
|
08:30 |
Personal income mm |
May |
% |
0.2 |
0.0 |
|
08:30 |
Consumption, adjusted mm |
May |
% |
0.3 |
-0.2 |
|
10:00 |
Pending sales change mm |
May |
% |
0.9 |
0.3 |
|
13:00 |
7-Yr Note Auction |
-- |
bl |
29.0 |
-- |
|
Fri, Jun 28 |
|||||
|
09:45 |
Chicago PMI |
Jun |
-- |
56.0 |
58.7 |
|
09:55 |
U.Mich sentiment |
Jun |
-- |
82.7 |
82.7 |
|
* mm: monthly | yy: annual | qq: quarterly | "w/e" in "period" column indicates a weekly report * Q1: First Quarter | Adv: Advance Release | Pre: Preliminary Release | Fin: Final Release * (n)SA: (non) Seasonally Adjusted * PMI: "Purchasing Managers Index" |
|||||


