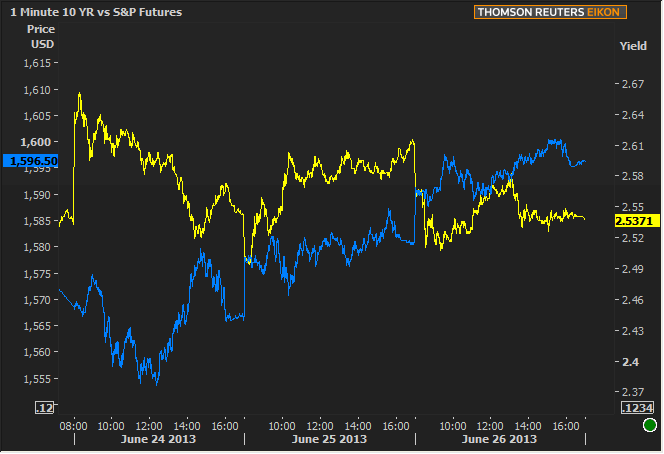
If you were to say "QE cues" quickly out loud, it might sound like "kewy kews." Acronyms and abbreviations abound in the realm of market-watching and it's time for a convenient shorthand for the "QE on/off" concept (send us your suggestions!). This refers to the phenomenon whereby stock prices and bond yields vary inversely to a large enough extent that charts look like this (This is not a Rorschach test):

If that was a Rorschach test, you'd be legally sane if your answer had anything to do with the "QE on/off" trade. Other acceptable answers include descriptions of dogs being trained to wait patiently for a treat while the trainer holds the treat up and moves it from side to side. In fact, if you've seen this in real life, you've seen exactly what's happening with both sides of the market post-FOMC. Does this continue to be the case right through to next week's NFP?
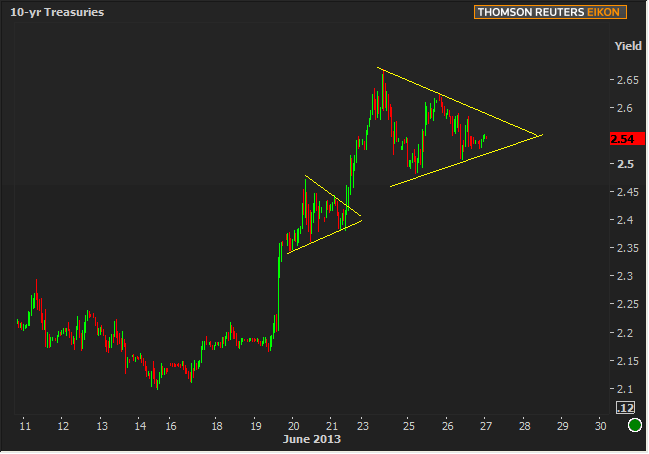
Probably not to the same extent as the past 3 sessions. Now that we've gone a long way toward carving out our second major consolidative range following last week's FOMC events (because everything from Wednesday through Friday was its own discreet consolidation, as can be seen in the chart below), we're getting to a point where things are likely to break down a bit due to month-end/quarter-end. If this triangle was emerging mid-month, markets would be even more likely to continue on with the same tango, but month-end trading considerations may cause more marching to the beat of one's own drum (in simpler terms: Treasuries may have to go where they're going to go to some extent, regardless of what stocks are doing and what the data might be suggesting).

The exception is data that makes a compelling argument for adjusting the policy outlook. This would look like a Jobless Claims number that is under 320 or over 375k, or Personal Consumption that's 0.6 or better (or -0.3 or worse). Such numbers would probably be sufficient to act as a treat waved in one direction or the other before the eyes of patient markets. Pending Home Sales is doubly interesting to whatever extent you buy into the notion that the Fed is reassured about tapering due to a frothy housing market. In that case, Pending Sales that rise much more than expected could be especially damning evidence in the case for QE4EVA (now there's a good abbreviation!).
|
Week Of Mon, Jun 23 2013 - Fri, Jun 27 2013 |
|||||
|
Time |
Event |
Period |
Unit |
Forecast |
Prior |
|
Mon, Jun 24 |
|||||
|
08:30 |
National Activity Index |
May |
-- |
-- |
-0.53 |
|
Tue, Jun 25 |
|||||
|
08:30 |
Durable Goods |
May |
% |
3.0 |
3.5 |
|
09:00 |
FHFA Home Price mm |
Apr |
% |
-- |
1.3 |
|
09:00 |
Case Shiller Home Prices |
Apr |
% |
1.2 |
1.4 |
|
10:00 |
New home sales-units mm |
May |
ml |
0.463 |
0.454 |
|
10:00 |
Consumer confidence |
Jun |
-- |
75.5 |
76.2 |
|
13:00 |
2-Yr Note Auction |
-- |
bl |
35.0 |
-- |
|
Wed, Jun 26 |
|||||
|
07:00 |
MBA Mortgage market index |
w/e |
-- |
-- |
648.9 |
|
07:00 |
MBA 30-yr mortgage rate |
w/e |
% |
-- |
4.17 |
|
08:30 |
GDP Final |
Q1 |
% |
2.4 |
2.4 |
|
08:30 |
GDP deflator Final |
Q1 |
% |
1.1 |
1.2 |
|
13:00 |
5yr Treasury Auction |
-- |
bl |
35.0 |
-- |
|
Thu, Jun 27 |
|||||
|
08:30 |
Midwest manufacturing |
May |
-- |
-- |
95.9 |
|
08:30 |
Personal income mm |
May |
% |
0.2 |
0.0 |
|
08:30 |
Consumption, adjusted mm |
May |
% |
0.3 |
-0.2 |
|
10:00 |
Pending sales change mm |
May |
% |
0.9 |
0.3 |
|
13:00 |
7-Yr Note Auction |
-- |
bl |
29.0 |
-- |
|
Fri, Jun 28 |
|||||
|
09:45 |
Chicago PMI |
Jun |
-- |
56.0 |
58.7 |
|
09:55 |
U.Mich sentiment |
Jun |
-- |
82.7 |
82.7 |
|
* mm: monthly | yy: annual | qq: quarterly | "w/e" in "period" column indicates a weekly report * Q1: First Quarter | Adv: Advance Release | Pre: Preliminary Release | Fin: Final Release * (n)SA: (non) Seasonally Adjusted * PMI: "Purchasing Managers Index" |
|||||


