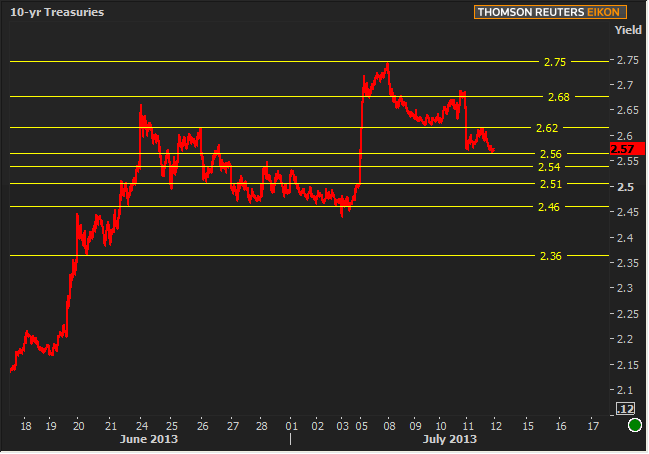
Bernanke's Wednesday night soothe-saying (as opposed to soothsaying--it's funny if you think about it) was enough to get bond markets through Thursday in a potentially contemplative stance heading in to next week. Once this morning's economic data is out of the way, we'll either be left with a market that has 2 feet and a hand out the door or a thoughtful jockeying for position ahead of next week's early economic data and Bernanke Congressional testimony later in the week. In considering the potential position jockeying, here are probably way too many near term pivot points in 10yr yields.

A few notes on the above:
- 2.46 or thereabouts is a biggie. That was the post FOMC Announcement high and subsequent month-end low as well as an early July low. For now, that's the contender to beat if you're a fan of seeing meaningfully lower rates again.
- We might not get there today, so keep an eye on 2.54-ish, which was right in line with pre-NFP yields and fairly central to the late June consolidation.
- We might go higher today, in which case, 2.62 seems like the obvious supportive challenge
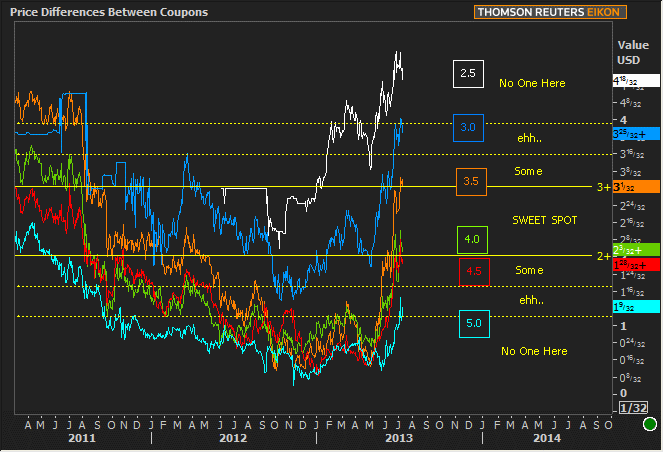
If we do happen to improve, the implications for MBS will be that Fannie 3.5s potentially scrape together a modicum of liquidity going forward. What in the world does that mean? Basically, new MBS are only going to be bought and sold if prevailing rates are such that those MBS buckets are filled. Right now, Fannie/Freddie 4.0s are clearly getting filled with rates from 4.375 to 4.875 all going into 4.0s. Rates under 4.375 fill 3.5 buckets. There's not an abundantly important implication here other than liquidity helps prices move a bit less abruptly and helps file down some of the necessary margins in rate sheets.
Here's a crazy chart that speaks to which coupons are likely to be more liquid based on prices. The lines are color coded to a particular coupon (actually, the lines are the price difference between that particular coupon and the next one higher, or "swap"). When that price difference is in the 2 to 3 point range, the implication is better for liquidity. As you can see, 3.5's have been rapidly pushed out the frame while 4.0s have entered. Note that historically, there have really only ever been TWO coupons in the sweet spot at any given time, but that much like mid 2011, more than two coupons are close to either edge of the sweet spot. This speaks to the uncertainty in play, and the fact that MBS traders are preparing for multiple eventualities.

|
Week Of Mon, Jul 8 2013 - Fri, Jul 12 2013 |
|||||
|
Time |
Event |
Period |
Unit |
Forecast |
Prior |
|
Mon, Jul 8 |
|||||
|
15:00 |
Consumer credit |
May |
bl |
12.50 |
11.10 |
|
Tue, Jul 9 |
|||||
|
13:00 |
3-Yr Note Auction |
-- |
bl |
32.0 |
-- |
|
Wed, Jul 10 |
|||||
|
07:00 |
MBA 30-yr mortgage rate |
w/e |
% |
-- |
4.58 |
|
07:00 |
MBA Mortgage market index |
w/e |
-- |
-- |
555.5 |
|
10:00 |
Wholesale inventories mm |
May |
% |
0.3 |
0.2 |
|
10:00 |
Wholesale sales mm |
May |
% |
0.4 |
0.5 |
|
13:00 |
10yr Treasury Auction |
-- |
bl |
21.0 |
-- |
|
14:00 |
FOMC Minutes for June 18-19 |
-- |
-- |
-- |
-- |
|
Thu, Jul 11 |
|||||
|
08:30 |
Export prices mm |
Jun |
% |
-0.1 |
-0.5 |
|
08:30 |
Initial Jobless Claims |
w/e |
k |
340 |
343 |
|
08:30 |
Jobless claims 4-wk avg |
w/e |
k |
-- |
345.50 |
|
08:30 |
Import prices mm |
Jun |
% |
0.1 |
-0.6 |
|
13:00 |
30-Yr Treasury Auction |
-- |
bl |
13.0 |
-- |
|
14:00 |
Federal budget, $ |
Jun |
bl |
40.0 |
-139.0 |
|
Fri, Jul 12 |
|||||
|
08:30 |
Producer prices, core yy |
Jun |
% |
1.6 |
1.7 |
|
08:30 |
Producer prices, core mm |
Jun |
% |
0.1 |
0.1 |
|
08:30 |
Producer prices mm |
Jun |
% |
0.5 |
0.5 |
|
09:55 |
Consumer Sentiment |
Jul |
-- |
85.0 |
84.1 |
|
* mm: monthly | yy: annual | qq: quarterly | "w/e" in "period" column indicates a weekly report * Q1: First Quarter | Adv: Advance Release | Pre: Preliminary Release | Fin: Final Release * (n)SA: (non) Seasonally Adjusted * PMI: "Purchasing Managers Index" |
|||||


