Economic data shows up today, and there's reason to believe that it won't be as relevant as it otherwise might be. Chief among these reasons is the ongoing range-finding process for bond markets (and stock markets for that matter). This process puts the highest premiums on liquidity and momentum. The collective herd has been running full tilt after being spooked last week and we continue waiting for them to slow down before even thinking about what they might do next.
Despite the fact that Dallas Fed Pres Fisher yesterday said: "big money does organize itself somewhat like feral hogs. If they detect a weakness or a bad scent, they’ll go after it," the market doesn't really work like that any more, if it ever did. In fact, if recent movement is the result of any cohesive effort by any cross-section of market participants, the best thing you could say about it is that they've hopelessly failed. The only winner has been volatility, and all sizes of "money"--all pigs feral or otherwise--have simply been running from the ax.
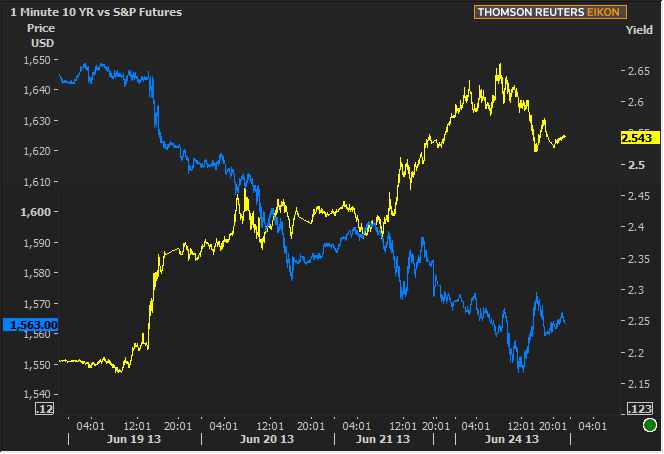
Every session since last week's FOMC events has seen some indication that the 'running of the pigs' (no swiney implications about markets here, just making fun of Fisher's worldview) may be slowing--each time slightly more convincing. They ran right off a cliff first thing Monday morning and subsequently gave the best indication yet that they might start heading the other direction. Incidentally, equities markets have given similar--perhaps better--glimpses of this phenomenon. Look at each of the 4 previous trading sessions and consider the following:
19th: All down after Fed, no bounce. stock/bond prices both taking big hits.
20th: Selling continues almost all day, but finally bounces heading into close. Some stability overnight
21st: Selling picks up againand results in most prominent bounce so far for equities (blue line)
24th: Even on the 21st, money was already on the way out the door for the weekend, and the trend continues into the domestic session, ultimately setting the stage for the biggest bounce of the post-FOMC trade. Does biggest mean best? We'll see how things go today, but trying to front-run the bounce has been very painful so far. Hope>expectation.

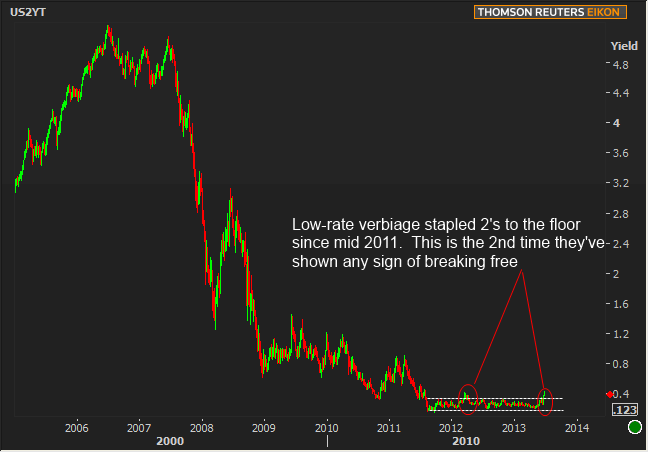
While we wait to see if things stay the same or break the mold in terms of the momentum seen above, we also have reason to be more interested in whether or not things change for the 2yr Note auction we've been ignoring since mid-2011. As discussed ad nauseum, when the Fed introduced the calendar date into the low rate verbiage, the short end of the yield curve was effectively stapled to the floor because a 2yr duration was within the "2013" window. As the date moved back and as accommodation continued to be a question of "how much more might we need" (as opposed to the current question wreaking havoc: "how soon will we start having less?"), 2's continued to not matter. Now they might matter again. The 3yr auction already gave us a glimpse of this 2 weeks ago and we'll be curious to see how markets react to 2's today at 1pm.

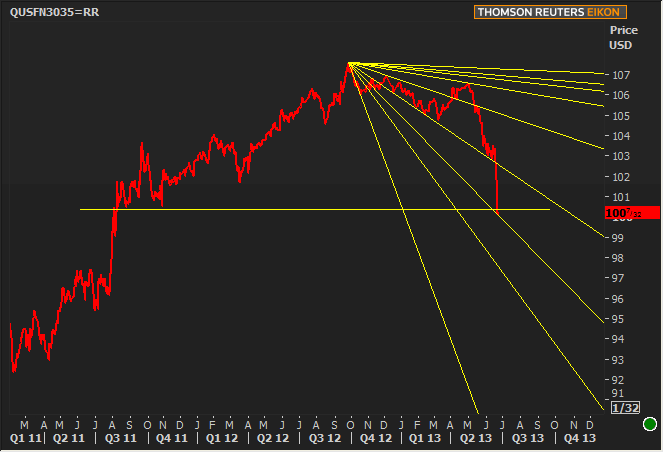
On a final "waiting" note, we're also waiting to see whether or not 100-00 continues to be end-of-day support for Fannie 3.5s. Pretty epic struggle here (and all hope looked lost for most of the day yesterday to boot). Next support is a ghastly 3 points lower both based on early 2011 highs and the trusty Gann fan which seems to have enjoyed some relevance since QE3 (break of the yellow lines suggest a move to the next yellow line before crossing back over the originally broken line--so far this has been 100% relevant in terms of Fannie 3.5 closing levels since QE3).

That leaves economic data as third fiddle. Whatever momentum we see today is likely to either already be in place by the time data starts hitting and the only way data stands a chance to change that momentum is if it manages to be shockingly far from consensus. I know it seems like "data should matter more if the Fed's watching data for tapering cues," but probably not this data, and probably not yet, with the exception of an impressively big deviation from consensus.
|
Week Of Mon, Jun 23 2013 - Fri, Jun 27 2013 |
|||||
|
Time |
Event |
Period |
Unit |
Forecast |
Prior |
|
Mon, Jun 24 |
|||||
|
08:30 |
National Activity Index |
May |
-- |
-- |
-0.53 |
|
Tue, Jun 25 |
|||||
|
08:30 |
Durable Goods |
May |
% |
3.0 |
3.5 |
|
09:00 |
FHFA Home Price mm |
Apr |
% |
-- |
1.3 |
|
09:00 |
Case Shiller Home Prices |
Apr |
% |
1.2 |
1.4 |
|
10:00 |
New home sales-units mm |
May |
ml |
0.463 |
0.454 |
|
10:00 |
Consumer confidence |
Jun |
-- |
75.5 |
76.2 |
|
13:00 |
2-Yr Note Auction |
-- |
bl |
35.0 |
-- |
|
Wed, Jun 26 |
|||||
|
07:00 |
MBA Mortgage market index |
w/e |
-- |
-- |
648.9 |
|
07:00 |
MBA 30-yr mortgage rate |
w/e |
% |
-- |
4.17 |
|
08:30 |
GDP Final |
Q1 |
% |
2.4 |
2.4 |
|
08:30 |
GDP deflator Final |
Q1 |
% |
1.1 |
1.2 |
|
13:00 |
5yr Treasury Auction |
-- |
bl |
35.0 |
-- |
|
Thu, Jun 27 |
|||||
|
08:30 |
Midwest manufacturing |
May |
-- |
-- |
95.9 |
|
08:30 |
Personal income mm |
May |
% |
0.2 |
0.0 |
|
08:30 |
Consumption, adjusted mm |
May |
% |
0.3 |
-0.2 |
|
10:00 |
Pending sales change mm |
May |
% |
0.9 |
0.3 |
|
13:00 |
7-Yr Note Auction |
-- |
bl |
29.0 |
-- |
|
Fri, Jun 28 |
|||||
|
09:45 |
Chicago PMI |
Jun |
-- |
56.0 |
58.7 |
|
09:55 |
U.Mich sentiment |
Jun |
-- |
82.7 |
82.7 |
|
* mm: monthly | yy: annual | qq: quarterly | "w/e" in "period" column indicates a weekly report * Q1: First Quarter | Adv: Advance Release | Pre: Preliminary Release | Fin: Final Release * (n)SA: (non) Seasonally Adjusted * PMI: "Purchasing Managers Index" |
|||||


