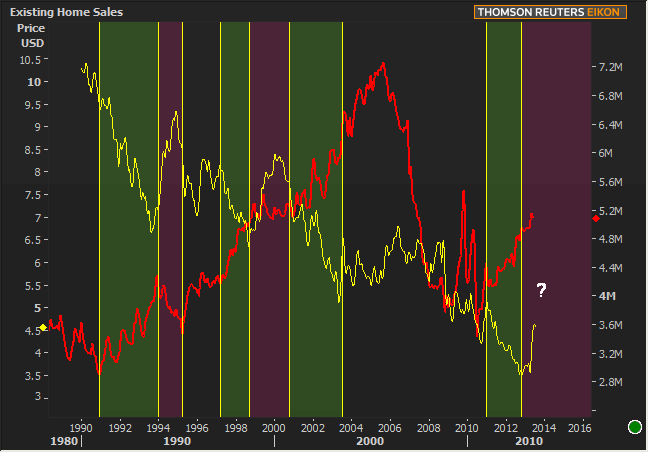
After The first two days of the week offered a fairly large sell-off and an equally large rally for bond markets--all against the backdrop of NO data and events--today finally brings both. On the data front, there's the moderately important Existing Home Sales report, seen improving from a 5.08 mln unit annualized pace to 5.15 mln. Check out the chart below for a long term comparison of Existing Sales vs Mortgage Rates. In the past, the most notable instances of falling rates have coincided with improvements in EHS (green) while the 2 of the 3 sharpest contractions (magenta) of the last 20 years have seen noticeable responses (i.e. sales decline after rates rise).

You're welcome to view these correlations as incidental and perhaps owing to "third variables," but you're also welcome to wonder if the recent rise in rates will join its historical counterparts and begin to take more of a toll on purchase demand. It seems worth noting that the 1994 spike in yields had already happened before we saw a noticeable response in EHS. The 1999-2000 spike might not look like it accomplished as much, but consider the rapid acceleration in EHS in 1997-1998.
The economic data probably isn't going to make or break the day's trading range. Even if it misses, that's not the info the Fed is looking for to trigger a delay in tapering time-frames (not unless it's joined by quite a few other metrics with similar suggestions.
The bigger wild card--and bigger potential market mover--is the afternoon's economic event: FOMC Minutes. The consensus is for an uneventful reading of the Minutes with the thesis being "what could we hear from the Fed that we haven't already heard and reacted to?" But when it comes to official releases from the FOMC, there's never any way to be sure.
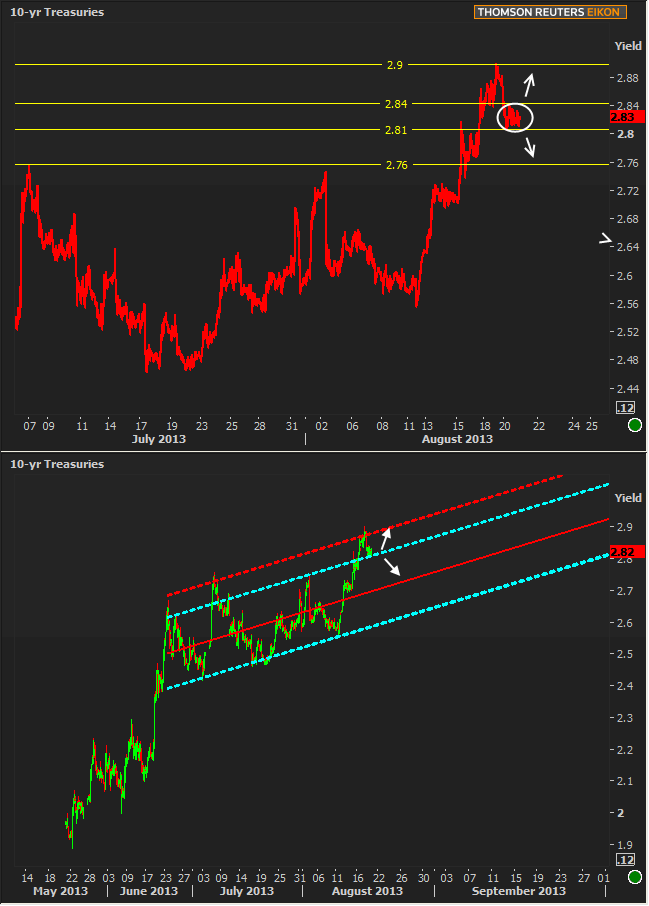
Based on recent trading patterns, it certainly seems that bond markets have honed in on a tidy little sideways range and are ready to head up or down to recent technical levels. Those levels look like recent highs at 2.9 and the very important pivot at 2.75+ (chart below rounded up to 2.76). Strong breaks of 2.84 or 2.81 suggest follow-through in their respective directions. The lower chart--more than anything--is just another way to look at the recent weakness as potentially setting up for a supportive bounce within the broader negative trend.

|
Week Of Mon, Aug 20 2013 - Fri, Aug 24 2013 |
|||||
|
Time |
Event |
Period |
Unit |
Forecast |
Prior |
|
Tue, Aug 20 |
|||||
|
08:30 |
National Activity Index |
Jul |
-- |
-- |
-0.13 |
|
Wed, Aug 21 |
|||||
|
07:00 |
Mortgage market index |
w/e |
-- |
-- |
471.9 |
|
07:00 |
MBA 30-yr mortgage rate |
w/e |
% |
-- |
4.56 |
|
10:00 |
Existing home sales |
Jul |
ml |
5.16 |
5.08 |
|
14:00 |
FOMC Minutes (Jul 31st Meeting) |
-- |
-- |
-- |
-- |
|
Thu, Aug 22 |
|||||
|
08:30 |
Initial Jobless Claims |
w/e |
k |
330 |
320 |
|
09:00 |
Monthly Home Price yy |
Jun |
% |
-- |
7.3 |
|
09:00 |
Monthly Home Price mm |
Jun |
% |
-- |
0.7 |
|
13:00 |
5yr TIPS Auction |
-- |
bl |
16.0 |
-- |
|
Fri, Aug 23 |
|||||
|
10:00 |
New home sales chg mm |
Jul |
% |
-- |
8.3 |
|
10:00 |
New home sales-units mm |
Jul |
ml |
0.485 |
0.497 |
|
* mm: monthly | yy: annual | qq: quarterly | "w/e" in "period" column indicates a weekly report * Q1: First Quarter | Adv: Advance Release | Pre: Preliminary Release | Fin: Final Release * (n)SA: (non) Seasonally Adjusted * PMI: "Purchasing Managers Index" |
|||||


