Last Week
- Bond markets continue pining for economic data, resigned to following fiscal drama headlines
- Said headlines provided bearish motivation (higher rate) on Wed/Thu
- Bond markets recovered somewhat on Friday though didn't make it back to Mon/Tue levels
- Week ended with bonds looking threatened by a debt-ceiling resolution of any duration
Today
- Week begins with bonds looking threatened by a debt-ceiling resolution
- Late Monday, headlines about tentative Senate deal shook Treasury Futures (MBS closed)
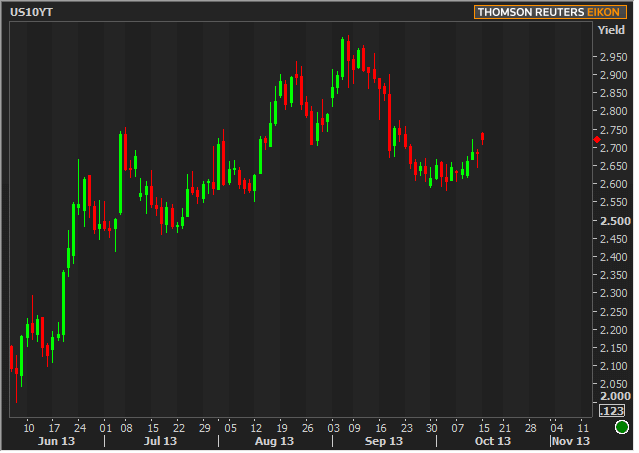
- 10yr yields popped to 2.74 at start of Asia session
- Economic data in short supply this week
- Lots of Fed speakers and fiscal headline potential
Strategy
The week begins largely where the previous week left off: with bond markets seemingly scared of any sort of debt-ceiling resolution. The move lower in rates in late September owes at least a small part of its success to fiscal drama (the lion's share going to the Sept 18th FOMC Announcement where the Fed abstained from tapering). Unfortunately, it's impossible to perfectly assign an amount of credit for that move. That makes it impossible to know how bonds will react when things are patched up (and the word "patched" is carefully chosen). Based on last week's reaction to headlines since last Wednesday, it looks like the familiar 2.71-2.75 zone in 10yr yields would come into play as some sort of battleground.
The only event that has a legitimate chance to bring about another challenge of the lowest recent rates will be the Employment Situation report from September (had been scheduled for 10/4). That could come as early as this week if things progress quickly enough with the government reopening. It could also be the case that we remain without a debt-ceiling deal for weeks, or it could have already happened by the time you read this. That's not a fun environment for bond markets even though they weathered the uncertainty uneventfully last week.
If more important data isn't already on the way (if government reopens), the focus of the week's data offerings is Thursday as it would host both weekly Jobless Claims as well as the Philly Fed Index. Apart from the data, there is a boatload of Fed speeches. Maybe they'll say something about tapering prospects in light of the shutdown. They did last week and markets didn't care much because the thoughts shared were in line with market consensus (i.e. "removal of Fed accommodation is less likely against the backdrop of fiscal uncertainty
Charts
Friday morning's notes discussed the "frypan bottom" formation, but could only get the chart to meet the classic requirements (rounded series of candlesticks giving way to single candle that gaps higher to confirm the trend) by restricting the time of trades comprising the candlesticks to CME hours. That's not a bad thing or even an unwise thing when it comes to technical analysis, but the point is this: unless bond markets rally significantly from early overnight levels, no adjustments will be required for the 10yr chart to give a "no excuses" confirmation of the reversal. Here's how it looks so far today:

Note: the reports that would have been released this week are struck-through in this calendar.
|
Week Of Tue, Oct 15 2013 - Fri, Oct 18 2013 |
|||||
|
Time |
Event |
Period |
Unit |
Forecast |
Prior |
|
Tue, Oct 15 |
|||||
|
08:30 |
NY Fed manufacturing |
Oct |
-- |
8.00 |
6.29 |
|
Wed, Oct 16 |
|||||
|
07:00 |
MBA Mortgage market index |
w/e |
-- |
-- |
455.9 |
|
07:00 |
MBA 30-yr mortgage rate |
w/e |
% |
-- |
4.42 |
|
|
|
|
|
|
|
|
10:00 |
NAHB housing market indx |
Oct |
-- |
58 |
58 |
|
Thu, Oct 17 |
|||||
|
08:30 |
Initial Jobless Claims |
w/e |
k |
335 |
374 |
|
|
|
|
|
|
|
|
|
|
|
|
|
|
|
|
|
|
|
|
|
|
|
|
|
|
|
|
|
10:00 |
Philly Fed Business Index |
Oct |
-- |
15.5 |
22.3 |
|
Fri, Oct 18 |
|||||
|
10:00 |
Leading index chg mm |
Sep |
% |
0.6 |
0.7 |


