Yesterday
- Fiscal headlines dominated yet again, debt deal took shape uneventfully
- Beige book was overwhelmed in terms of relevance
- Short term debt led the charge, lowering funding costs, benefiting longer maturities
- Technical levels and tradeflow considerations added momentum
- Rates were only modestly lower, despite a half point rally in Fannie 3.5s
Today
- Markets react to passage of debt deal overnight
- Earliest indications suggest potential return to range
- Most of this morning's economic data is reporting as normal
- When is NFP coming?
Strategy
Congress apparently thought the 10/17 debt ceiling deadline was a much bigger deal than financial markets. It's not that markets didn't perceive an actual default as a big deal--just that they'd already worked out that it would be at least another two weeks before any payee was at risk of not being paid by the US Government. As such, more than a few traders, analysts, and economists opined that the shutdown could last well past the actual debt ceiling deadline (which only marks the point beyond which Treasury can no longer issue new debt).
But here we are with both chambers of Congress having signed the bill well before the stroke of midnight and with shockingly little fanfare during the business day on Wednesday. The US Office of Management and Budget said late last night that Federal employees should expect to return to work on Thursday morning (given the time of day, we hope they have an excellent phone tree system in place, otherwise few will get the memo).
Meanwhile, we're left to wonder "what next?" The most immediate concern is the timing of NFP. We know that the BLS collates most of the data by the Wednesday of NFP week, and that they were still on the clock on the Monday of NFP week. That creates an outside chance of the payrolls data arriving within the next few business days, but we have no indication thus far whether they'll attempt to expedite it or take their sweet time.
Failing that, we at least have Jobless Claims and Philly Fed today. The latter is one of the more significant pieces of economic data that remained on the scheduled during the shutdown, and the market's reaction may offer clues as to the immediate role of economic data vs headlines and debt deal reactions.
Charts
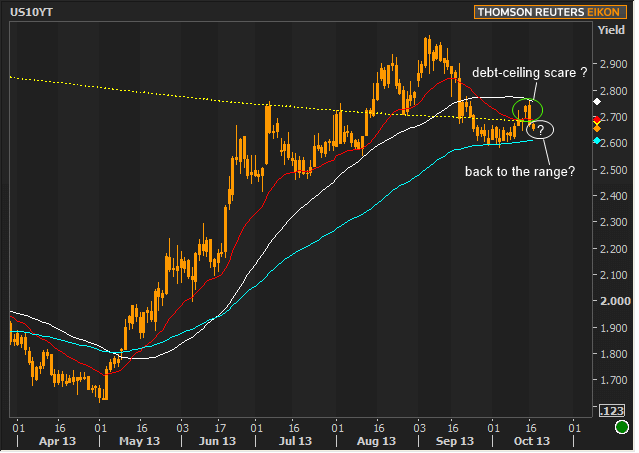
After starting the move toward higher yields by breaking out of the near term range over the past two days, 10yr Treasuries have quickly returned inside the upper boundaries near 2.67. The chart below has the 5yr moving average that we've tracked on several occasions as an upper-bound inflection point for the long term range. The shorter term moving average in red is right in line with the 5yr currently. The 80 day (teal) and 40 day (white) moving averages have offered resistance and support respectively.

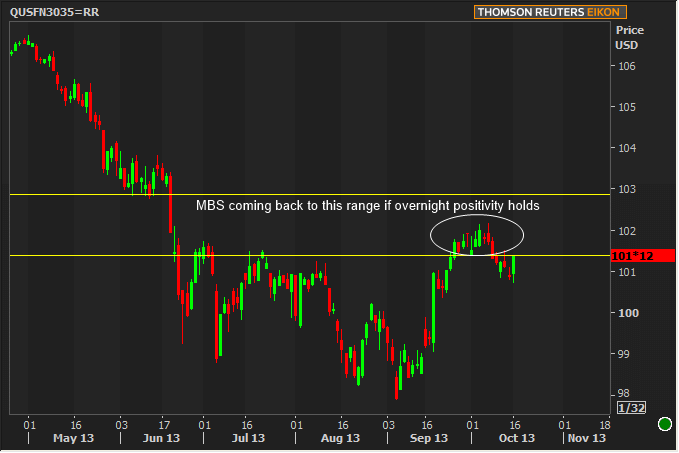
The following MBS chart hasn't had the privilege of being updated overnight, but if the current tenor of overnight activity remains, MBS will likely open back in their recently higher, narrower range.

Note: the reports that would have been released this week are struck-through in this calendar.
|
Week Of Tue, Oct 15 2013 - Fri, Oct 18 2013 |
|||||
|
Time |
Event |
Period |
Unit |
Forecast |
Prior |
|
Tue, Oct 15 |
|||||
|
08:30 |
NY Fed manufacturing |
Oct |
-- |
8.00 |
6.29 |
|
Wed, Oct 16 |
|||||
|
07:00 |
MBA Mortgage market index |
w/e |
-- |
-- |
455.9 |
|
07:00 |
MBA 30-yr mortgage rate |
w/e |
% |
-- |
4.42 |
|
|
|
|
|
|
|
|
10:00 |
NAHB housing market indx |
Oct |
-- |
58 |
58 |
|
Thu, Oct 17 |
|||||
|
08:30 |
Initial Jobless Claims |
w/e |
k |
335 |
374 |
|
|
|
|
|
|
|
|
|
|
|
|
|
|
|
|
|
|
|
|
|
|
|
|
|
|
|
|
|
10:00 |
Philly Fed Business Index |
Oct |
-- |
15.5 |
22.3 |
|
Fri, Oct 18 |
|||||
|
10:00 |
Leading index chg mm |
Sep |
% |
0.6 |
0.7 |


