Yesterday
- Volume/Volatility increased again, more so for Treasuries than MBS
- FOMC Minutes was the key event in terms of volatility, but didn't create new momentum
- New momentum potentially created itself as bonds weakened progressively
- Rate sheets managed to hold ground in most cases, but MBS ended at lows.
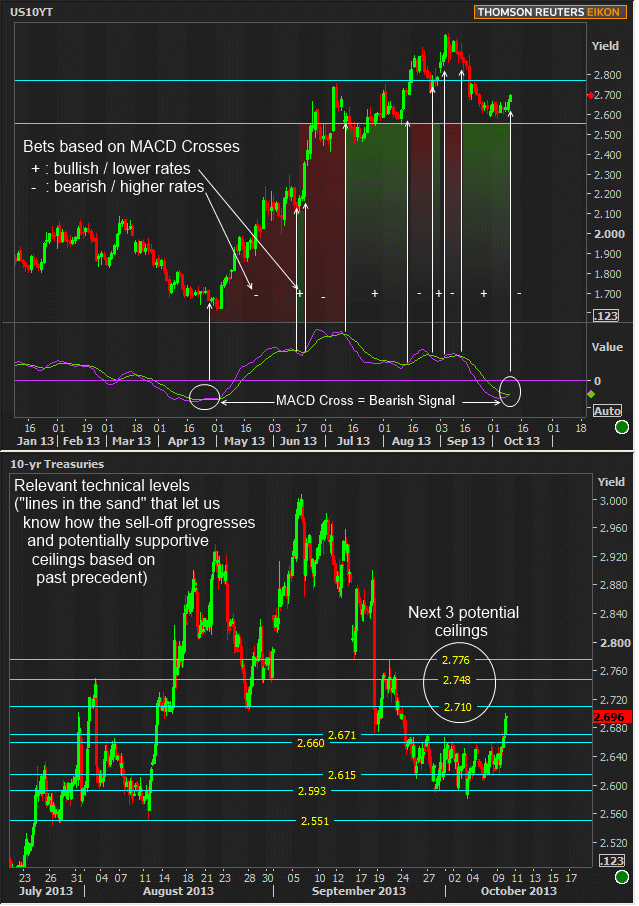
- Technical indicators are starting to turn
Today
- Assessing potential technical bearishness in bond markets (lower prices / higher yields)
- Holding out hope to return to previous range after 30yr Auction
- Today and tomorrow are last two days for Congress before debt ceiling
- Reuters citing sources saying Treasury/Fed planning for possible default
- Jobless Claims will report as normal
Strategy
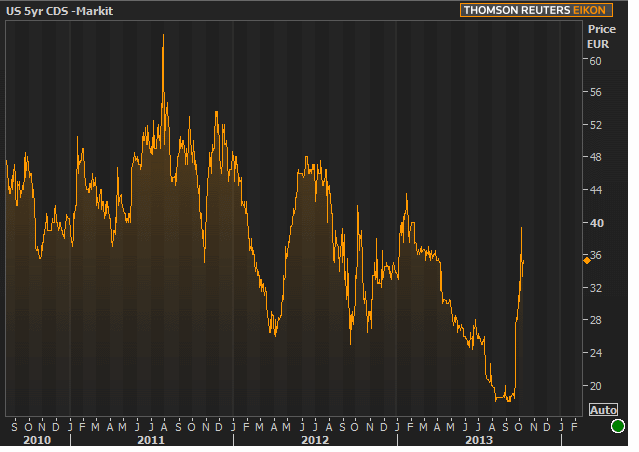
Markets have clearly begun pricing in various levels of default risk for the US. Sounds scary, but it's not the first time and it won't be the last. In fact, it was far worse in 2011, and just as sharp an increase in 2012 (chart 1). We've definitely seen SOME impact in longer-dated Treasuries, but emphasis on SOME. Historically, the correlation between default risk and 10yr yields is far from strong.
But 10yr yields were essentially weaker all day and weaker again to start the overnight session. MBS languished despite an absence of negative information. What gives? Perhaps "nothing gives" just yet and the bearishness is incidental, but the upcoming 30yr Bond auction is one factor along with debt ceiling concerns. The latter stem from the fact that today and tomorrow are the only two days Congress is scheduled to be in session until the 10/17 debt ceiling.
Economists and trade desks have noted that 10/17 isn't the day the US stops paying its bills, but it's when Treasury is no longer legally allowed to borrow money. They'll have cash on hand through at least 11/1, they say, and the first potential default on US Treasury payments isn't until 11/15. Here's more on possible default planning from Reuters:
The specifics of their planning remain unclear, but the source said an area of special focus is a key bank funding market known as the tri-party repurchase agreement, or repo, market, where banks often use Treasury bills, notes and bonds as collateral for short-term loans from other banks and big money market funds.
Some of the earliest alarm bells for the 2008 financial crisis emerged from this market, and on Wednesday interest rates demanded for accepting some T-bills as collateral shot to the highest in five months. Were the repo market to seize, easy access to cash by banks to meet short-term funding needs could be jeopardized, and that could have far-ranging implications for credit markets and the economy.
The source, who asked not to be identified, said officials refused to divulge details of the plans because they do not want to suggest to investors and Republican Congress members that the U.S. government can muddle through if the debt limit is not raised. Officials insisted there was no way to avoid an eventual default if the debt limit is not raised.
On Thursday, U.S. Treasury Secretary Jack Lew is scheduled to testify before the Senate Finance Committee and is likely to be grilled about the contingency plans by Senator Orrin Hatch, the panel's top Republican. (...full story)
Jobless Claims will report as normal today, providing the week's only official employment data. The last of the week's Treasury Auctions goes off at 1pm with 30yr Bonds. The best hope is to see a return to the recent, flat range after that. Otherwise, Treasuries will be confirming several bearish signals in charts. Beyond that, any debt-ceiling headline that's big enough has the power to get us back in the range, but we have no reason to expect it today vs two weeks from now.
Charts
US CDS chart, marked daily, reflecting 10/9, but not 10/10.

10yr Treasury yields with MACD. The important part is that when the purple line crosses the green line, that's a "signal" to trade in that direction. In other words, purple crossing above green is a signal to trade higher in yield / bearishly (aka "sell"). The green and red gradient sections show the various periods of bullishness and bearishness as suggested by this one particular study. For what it's worth, although MACD is a pretty standard-issue study in the world of technical analysis, it's only one of hundreds that could be applied.

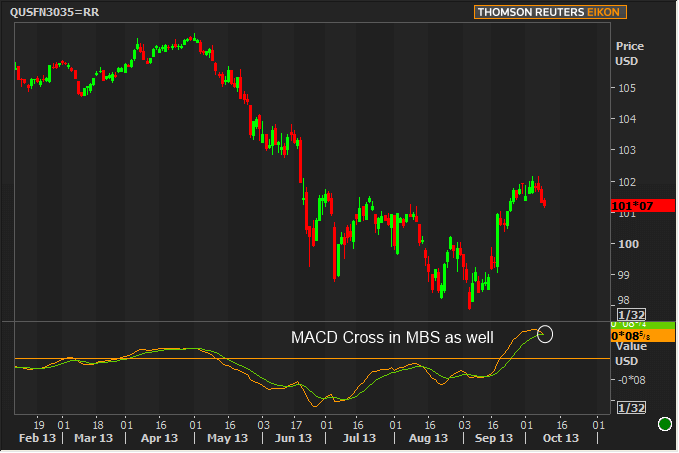
MBS version of the MACD chart just to show that MBS are throwing up the same signal as Treasuries.

Note: the reports that would have been released this week are struck-through in this calendar.
|
Week Of Tue, Oct 7 2013 - Fri, Oct 11 2013 |
|||||
|
Time |
Event |
Period |
Unit |
Forecast |
Prior |
|
Mon, Oct 7 |
|||||
|
15:00 |
Consumer credit |
Aug |
bl |
11.55 |
10.44 |
|
Tue, Oct 8 |
|||||
|
|
|
|
|
|
|
|
13:00 |
3-Yr Note Auction |
-- |
bl |
30.0 |
-- |
|
Wed, Oct 9 |
|||||
|
07:00 |
MBA Mortgage market index |
w/e |
-- |
-- |
450.2 |
|
07:00 |
MBA 30-yr mortgage rate |
w/e |
% |
-- |
4.49 |
|
|
|
|
|
|
|
|
13:00 |
10yr Treasury Auction |
-- |
bl |
21.0 |
-- |
|
14:00 |
FOMC Minutes (Sept 17-18 meeting) |
|
|
|
|
|
Thu, Oct 10 |
|||||
|
|
|
|
|
|
|
|
|
|
|
|
|
|
|
|
|
|
|
|
|
|
08:30 |
Initial Jobless Claims |
w/e |
k |
310 |
308 |
|
13:00 |
30-Yr Treasury Auction |
-- |
bl |
13.0 |
-- |
|
Fri, Oct 11 |
|||||
|
|
|
|
|
|
|
|
|
|
|
|
|
|
|
09:55 |
Consumer Sentiment |
Oct |
-- |
76.0 |
77.5 |
|
10:00 |
Business inventories mm |
Aug |
% |
0.3 |
0.4 |


