Last Week
- Holiday-shortened week began with bonds on the ropes after NFP
- Bonds rallied on Wednesday after release of Yellen's prepared remarks
- Rally extended on Thursday during Yellen Q&A
- Friday began weaker, but pulled up after Economic data
This Week
- Monday, Tuesday and Friday are slower, offering only Fed Speakers
- Wednesday is busy (Retail Sales and FOMC Minutes)
- Econ data is a factor again on Thursday with Jobless Claims and Philly Fed
Strategy
2.688, 2.684, and 2.691. These were the 3 10yr yield lows from Wednesday, Thursday and Friday last week. They represent a thorn in the side for what has otherwise been a reversal in the move toward higher rates following Nov 8th's NFP. From a technical standpoint, the implication this week is that continued failure to move below that vicinity runs the risk of reigniting the negative trends.
As is typically the case, the week's events can amplify or counteract the technical trends in play. To that end, there's disappointingly little on the first two days of the week. None of the economic data is market moving, though perhaps if the NAHB Housing Market Index managed to bounce lower, bond markets might pay attention as it would mean the most ridiculously bullish reading on the housing market finally found reason to be less so.
More worthy of attention will be Wednesday and Thursday, when we'll get the lion's share of the week's economic data as well as the FOMC Minutes on Wednesday afternoon. These minutes are from the meeting that produced the most recent FOMC Announcement at the end of October. That's the one where the Fed didn't really change much and surprised some market participants with the lack negativity (some expected the Fed to address the recent weakness in economic data).
Instead, the Fed removed the reference to "tightening of financial conditions," which many took to mean they think rates have fallen enough compared to the "possibly too high" levels seen mid-summer. Any takeaway from the Minutes would then need to be balanced against Yellen's ostensibly bond-friendly tone last week as well as the fairly relevant economic data, which includes standouts such as Retail Sales on Wednesday and Philly Fed on Thursday.
Charts
Recently ridiculously bullish NAHB Index.

10yr Fractals
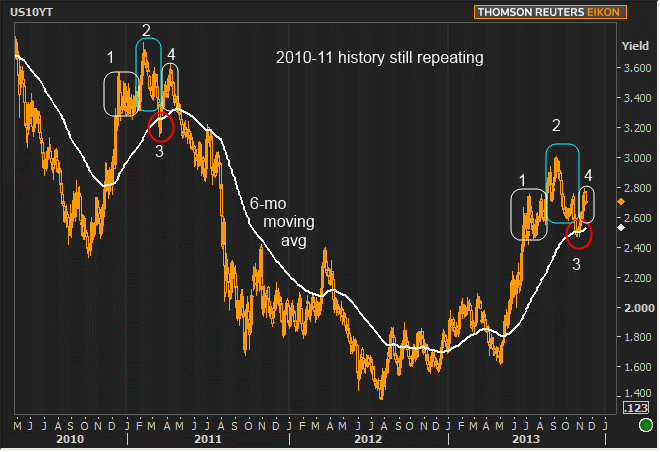
Almost two months ago, we discussed a big-picture phenomenon that tends to be true for longer term rates when they're recovering from a big move higher (here's the original discussion). The gist is that the first major move back toward longer-term moving averages tends to result in a bounce, even if rates ultimately return and break lower. So far, that's exactly what's happened.

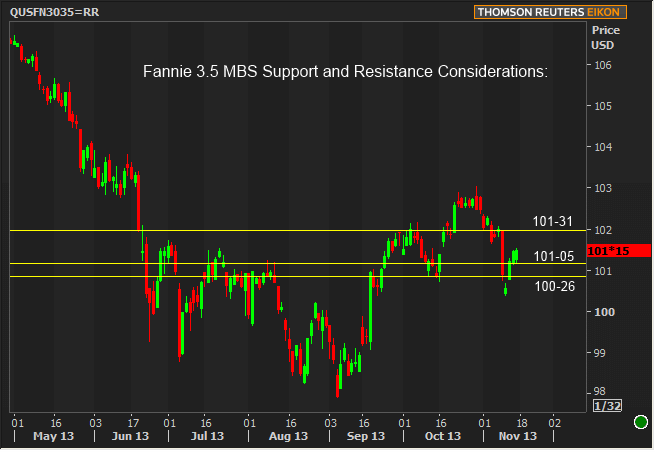
One convenient development for those inclined to float is that 2.75% overhead in 10yr yields are 101-05 and 100-26 in Fannie 3.5s provide good trip-wires to get more defensive (read: "locky"). Above 102, we'd look for opportunities to lock.

|
Week Of Tue, Nov 18 2013 - Fri, Nov 22 2013 |
|||||
|
Time |
Event |
Period |
Unit |
Forecast |
Prior |
|
Mon, Nov 18 |
|||||
|
10:00 |
NAHB housing market indx |
Nov |
-- |
56 |
55 |
|
Tue, Nov 19 |
|||||
|
08:30 |
Employment costs |
Q3 |
% |
0.5 |
0.5 |
|
Wed, Nov 20 |
|||||
|
07:00 |
Mortgage market index |
w/e |
-- |
-- |
461.7 |
|
07:00 |
MBA 30-yr mortgage rate |
w/e |
% |
-- |
4.44 |
|
08:30 |
Retail sales mm |
Oct |
% |
0.1 |
-0.1 |
|
08:30 |
Retail sales ex-autos mm |
Oct |
% |
0.1 |
0.4 |
|
08:30 |
Consumer Price Index (CPI) |
Oct |
% |
0.0 |
0.2 |
|
08:30 |
Core CPI Year over Year |
Oct |
% |
1.7 |
1.7 |
|
10:00 |
Business inventories mm |
Sep |
% |
0.3 |
0.3 |
|
10:00 |
Existing home sales |
Oct |
ml |
5.13 |
5.29 |
|
Thu, Nov 21 |
|||||
|
08:30 |
Producer Price Index (PPI) |
Oct |
% |
-0.2 |
-0.1 |
|
08:30 |
Core PPI, Year over year |
Oct |
% |
1.3 |
1.2 |
|
10:00 |
Philly Fed Business Index |
Nov |
-- |
15.0 |
19.8 |
|
13:00 |
10yr TIPS Auction |
-- |
bl |
13.0 |
-- |


