Yesterday
- Big nasty sell-off, partly in the works even before FOMC
- FOMC Minutes greatly accelerated the weakness
- Fed sounding a lot less opposed to asset purchases reduction than surveys suggest
Today
- Decent amount of economic data but no watershed events
- PPI is forgettable, Jobless Claims less so, and Philly Fed is the focal point
- 10yr TIPS auction at 1pm
- Technical and tradeflow considerations will play out and tell us more about momentum
Strategy
Yesterday was a busy and painful day for bond markets. Volumes were as high as they've been since September's "no taper" FOMC Announcement and by the end of the day, so were Treasury yields!
(Read More: Making Sense of the FOMC Minutes' Impact on Mortgage Rates)
(Read More: MBS RECAP: Bond Markets Weakest Since September after FOMC)
Today's economic data, taken together, is in the same league as yesterday's Retail Sales, and with the absence of FOMC Minutes looming in the afternoon, will actually be less inhibited when it comes to having an impact on trading levels. Especially after the 10am Philly Fed index, we could see the most determined movement of the day as it's the last major point of data before a fairly slow 3-day holiday week ahead.
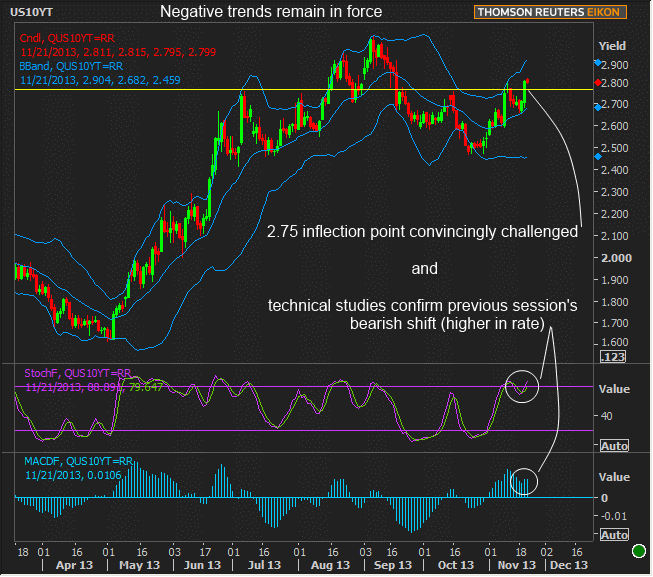
On November 12th, 10yr Treasuries hit 2.792, so if we can manage to close under that today, it would make for a less anxious reading on the weakness suggested by yesterday's negative technical confirmation. Additionally, in a world where the Fed so recently spoke about 3% 10yr yields as creating "tight financial conditions," we'd hope they wouldn't be overly keen to cause much more downside than what we got yesterday.
Only time will tell and today is an important one when it comes to assessing trading sentiment in bond markets. It's easy to swim with the tide of weakness after a 2pm FOMC communication, but morning trading on the following session is typically revealing. Keep an eye on the 2.74-2.755 zone in case of a rally. If it offers firm resistance to further improvement, that's pretty bad. In the case of further weakness, the intraday range may be fairly wide, and there's less of a technical framework to offer support. I guess that means if it's bad, it could be really bad, and if it's good, it's only really good if it's challenging the well-traveled inflection point around 2.75.
Charts
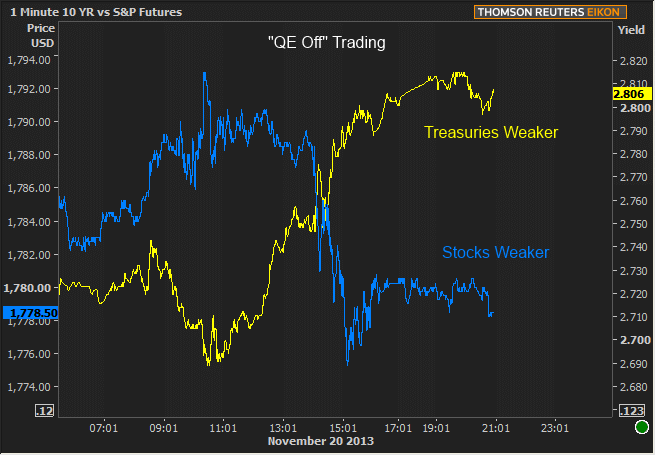
Just a visual confirmation that yesterday's FOMC Minutes were taken as a direct commentary on life-expectancy of QE. (I.E. less QE = both stocks and bonds lose).

Negative technical studies in Treasuries and the 2.75 inflection point mentioned above.

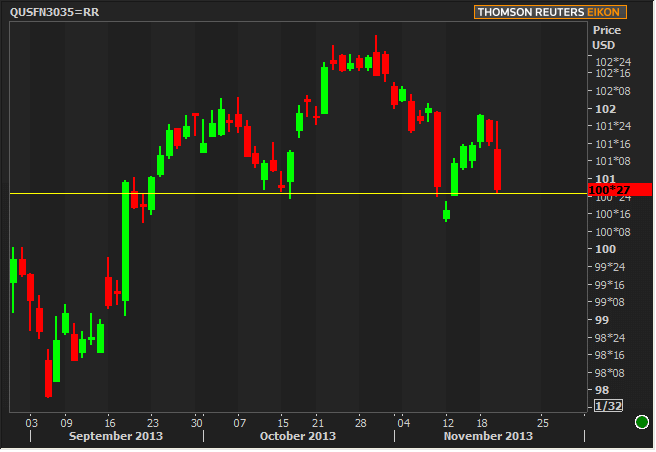
MBS have an inflection point of their own, and in this case, it held up yesterday.

|
Week Of Tue, Nov 18 2013 - Fri, Nov 22 2013 |
|||||
|
Time |
Event |
Period |
Unit |
Forecast |
Prior |
|
Mon, Nov 18 |
|||||
|
10:00 |
NAHB housing market indx |
Nov |
-- |
56 |
55 |
|
Tue, Nov 19 |
|||||
|
08:30 |
Employment costs |
Q3 |
% |
0.5 |
0.5 |
|
Wed, Nov 20 |
|||||
|
07:00 |
Mortgage market index |
w/e |
-- |
-- |
461.7 |
|
07:00 |
MBA 30-yr mortgage rate |
w/e |
% |
-- |
4.44 |
|
08:30 |
Retail sales mm |
Oct |
% |
0.1 |
-0.1 |
|
08:30 |
Retail sales ex-autos mm |
Oct |
% |
0.1 |
0.4 |
|
08:30 |
Consumer Price Index (CPI) |
Oct |
% |
0.0 |
0.2 |
|
08:30 |
Core CPI Year over Year |
Oct |
% |
1.7 |
1.7 |
|
10:00 |
Business inventories mm |
Sep |
% |
0.3 |
0.3 |
|
10:00 |
Existing home sales |
Oct |
ml |
5.13 |
5.29 |
|
Thu, Nov 21 |
|||||
|
08:30 |
Producer Price Index (PPI) |
Oct |
% |
-0.2 |
-0.1 |
|
08:30 |
Core PPI, Year over year |
Oct |
% |
1.3 |
1.2 |
|
10:00 |
Philly Fed Business Index |
Nov |
-- |
15.0 |
19.8 |
|
13:00 |
10yr TIPS Auction |
-- |
bl |
13.0 |
-- |


