Yesterday
- Started out weaker after Claims data, 10's hit 2-mo Highs
- Volume and anxiety were high until much weaker than expected Philly Fed (10am)
- Philly data made for quick, shallow bounce which extended after 11am
- Day was essentially over by 11:35am, with a 2bp range from there until close
- Yellen nomination approved in Senate Committee, full vote in December
- Landmark legislation in Senate ending filibusters for Presidential nominees (more...)
- Implications for Mel Watt taking over at the FHFA (more...)
Today
- No significant economic data scheduled
- Limited data next week ahead of Thanksgiving holiday
- Could make today a slow session
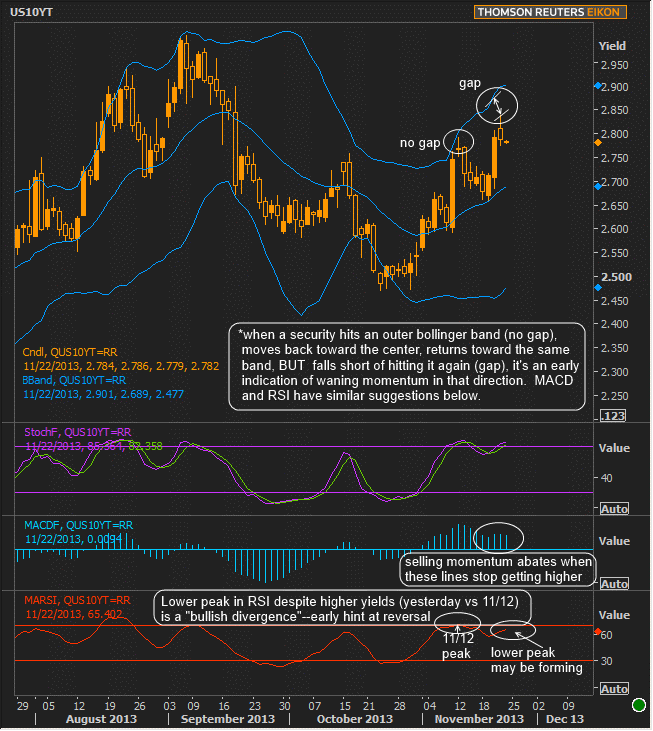
- Technicals leave door open for recovery (chart below)
Strategy
There are a lot of individual events worth mentioning from yesterday's session--slightly stronger Jobless Claims, much weaker Philly Fed, FOMC speakers, Yellen's committee confirmation, and the filibuster legislation. But at the end of the day, the only relevant takeaway from the price action was that bond markets went sideways after Wednesday's losses.
The argument could be made that this wouldn't have been the case had it not been for the weak Philly Fed data and that's valid, but it's likely the difference between going sideways at slightly stronger or slightly weaker levels. If Philly Fed had been exceptionally strong, the selling probably would have extended, but we'd still be looking at a "post-selling consolidation" heading into this weekend.
Any weakness that happens today is more likely to be the "inconsequential drifting" type, unless it's accompanied by big volume for some reason. Any strength will contend with hefty technical resistance by the time it gets to 2.74% in 10's. Some time soon, markets will decide on the posture with which they'll approach next week's extended holiday weekend, and that decision likely won't be made today.
Charts
Various 10yr yield technicals, all discussed on the chart itself:

Are Fannie 3.5 MBS already hinting at a consolidative "triangle" for November? Possibly. Even if the lines of a triangle don't hold up perfectly, their slopes can still represent the competing trends that are in play. Given the fundamental environment and what's at stake with the early December NFP, it wouldn't be a surprise to see more consolidation between now and then.

|
Week Of Tue, Nov 18 2013 - Fri, Nov 22 2013 |
|||||
|
Time |
Event |
Period |
Unit |
Forecast |
Prior |
|
Mon, Nov 18 |
|||||
|
10:00 |
NAHB housing market indx |
Nov |
-- |
56 |
55 |
|
Tue, Nov 19 |
|||||
|
08:30 |
Employment costs |
Q3 |
% |
0.5 |
0.5 |
|
Wed, Nov 20 |
|||||
|
07:00 |
Mortgage market index |
w/e |
-- |
-- |
461.7 |
|
07:00 |
MBA 30-yr mortgage rate |
w/e |
% |
-- |
4.44 |
|
08:30 |
Retail sales mm |
Oct |
% |
0.1 |
-0.1 |
|
08:30 |
Retail sales ex-autos mm |
Oct |
% |
0.1 |
0.4 |
|
08:30 |
Consumer Price Index (CPI) |
Oct |
% |
0.0 |
0.2 |
|
08:30 |
Core CPI Year over Year |
Oct |
% |
1.7 |
1.7 |
|
10:00 |
Business inventories mm |
Sep |
% |
0.3 |
0.3 |
|
10:00 |
Existing home sales |
Oct |
ml |
5.13 |
5.29 |
|
Thu, Nov 21 |
|||||
|
08:30 |
Producer Price Index (PPI) |
Oct |
% |
-0.2 |
-0.1 |
|
08:30 |
Core PPI, Year over year |
Oct |
% |
1.3 |
1.2 |
|
10:00 |
Philly Fed Business Index |
Nov |
-- |
15.0 |
19.8 |
|
13:00 |
10yr TIPS Auction |
-- |
bl |
13.0 |
-- |


