Yesterday
- Bond markets weaker even before data
- After data (ISM Services), more sincere selling began
- MBS had worst day in exactly 2 months (19 ticks weaker vs previous close)
- 10yr yields ended near top of "shutdown range" (2.67)
Today
- No significant data on tap
- Bearish (read: higher rate) trends intact but close to "regroup or retreat" decision
- Any major movement today is a major clue (about Fed expectations)
Strategy
Sizing up the day, there's nothing special about it in terms of data or events. As such, it will be especially telling if we happen to see a big continuation of yesterday's weakness. It would indicate that that same sort of semi-secret market mover is in play as we saw in May when market participants gradually (then quickly) came to terms with the tapering timeline.
Said timeline has never really gone away though it has certainly faded a bit. The focus is no longer so much on the first instance of tapering, but rather on divining what the Fed's probable bigger-picture gameplan might be. I'd qualify everything else by saying that it doesn't make much sense to consider the bigger-picture gameplan if it is malleable based on the data, but let's do it anyway.
Here's the last time we considered the true bigger picture: 2 Charts, 2 Ways We May Be Engineering Bond Market History. Even if you don't click through to those charts, the gist is that when you line up the timing of Fed policy communications and market movement, it almost looks like the Fed is trying to direct interest rates higher, but is cognizant that past examples like 1994 and 1998/99 were "too high, too fast."
Such hypotheses became increasingly interesting yesterday afternoon when the following started making rounds: Two heavyweight Fed papers argue for stronger policy action. The notion is that the Fed could do even more to support the recovery by lowering the unemployment threshold. That sounds nice at first glance, but it's not.
It's not nice because lowering the U/E threshold would be sort of a green light to begin tapering a bit sooner. After all, any abject sell-off would be mitigated by the threshold change and longer term commitment to lower front-end rates. The downside, then, is really a lack of upside. In that scenario, further progress below--say, 2.47-ish in terms of 10yr yields (or 4% in terms of mortgage rates) could quickly become a bridge too far. We'd get immunity from "steep losses" but give up "hope for sub 4%" rates in return... maybe. It's impossible to say for sure, but it would certainly jive with previous clues about "engineering" an interest rate reality.
Charts
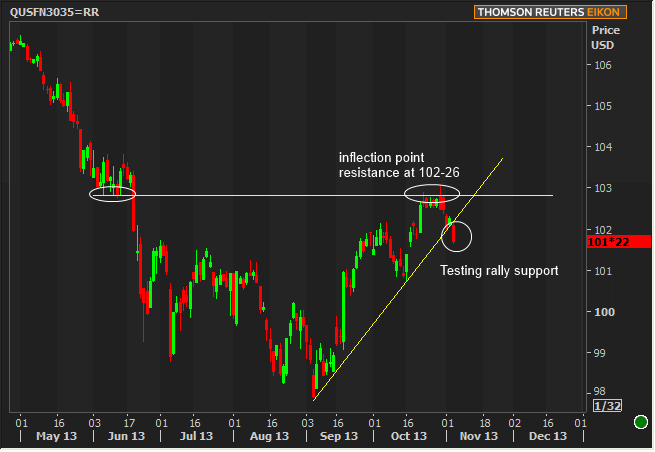
Nothing too exciting here--largely because MBS are set to drop 10 ticks or so over the weekend, due to the roll--but yesterday's close broke the 2-month uptrend. From a technical standpoint, we'd need to see another day below in order to confirm, and even then, this isn't the be all, end all of technical indicators.

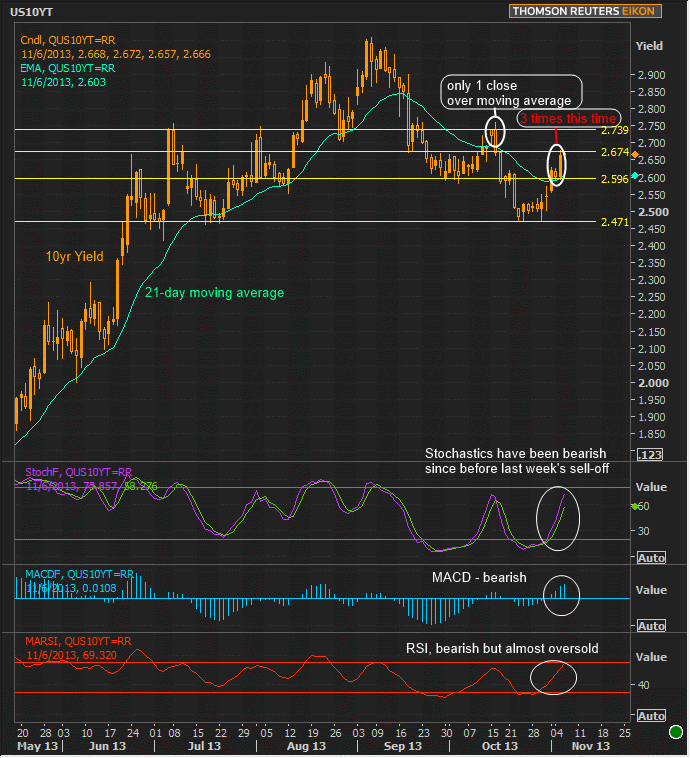
No technical indicators are definitive, but here are several of the most common, and applied to a security that's much more reliable as a technical test subject. In a nutshell, the break and close above the 21-day moving average along with the 3 technical studies on the lower margin all speak to the confirmation of the negative bias we noted last Thursday morning. The silver lining is that stochastics are close to oversold and RSI is right on the edge. That's just a pretentious way to say that that it wouldn't look out of place for the selling trend to reverse. This would likely need to be brought about by weaker data on Thursday or Friday.

|
Week Of Tue, Nov 4 2013 - Fri, Nov 8 2013 |
|||||
|
Time |
Event |
Period |
Unit |
Forecast |
Prior |
|
Mon, Nov 4 |
|||||
|
10:00 |
Factory Orders (Delayed for Aug) |
Aug |
% |
0.3 |
-2.4 |
|
10:00 |
Factory orders (on time for Sep) |
Sep |
% |
1.7 |
-- |
|
Tue, Nov 5 |
|||||
|
10:00 |
ISM Non-Manufacturing PMI |
Oct |
-- |
54.0 |
54.4 |
|
Wed, Nov 6 |
|||||
|
07:00 |
Mortgage market index |
w/e |
-- |
-- |
483.7 |
|
07:00 |
MBA 30-yr mortgage rate |
w/e |
% |
-- |
4.33 |
|
10:00 |
Leading index chg mm |
Sep |
% |
0.6 |
0.7 |
|
Thu, Nov 7 |
|||||
|
08:30 |
Initial Jobless Claims |
w/e |
K |
335 |
340 |
|
08:30 |
GDP |
Q3 |
% |
1.9 |
2.5 |
|
15:00 |
Consumer credit |
Sep |
bl |
11.50 |
13.63 |
|
Fri, Nov 8 |
|||||
|
08:30 |
Private Payrolls |
Oct |
k |
135 |
126 |
|
08:30 |
Average workweek hrs |
Oct |
hr |
34.5 |
34.5 |
|
08:30 |
Non-farm payrolls |
Oct |
k |
125 |
148 |
|
08:30 |
Unemployment rate mm |
Oct |
% |
7.3 |
7.2 |
|
08:30 |
Personal income |
Sep |
% |
0.3 |
0.4 |
|
08:30 |
Consumption, adjusted |
Sep |
% |
0.2 |
0.3 |
|
09:55 |
U.Mich sentiment |
Nov |
-- |
75.0 |
73.2 |


