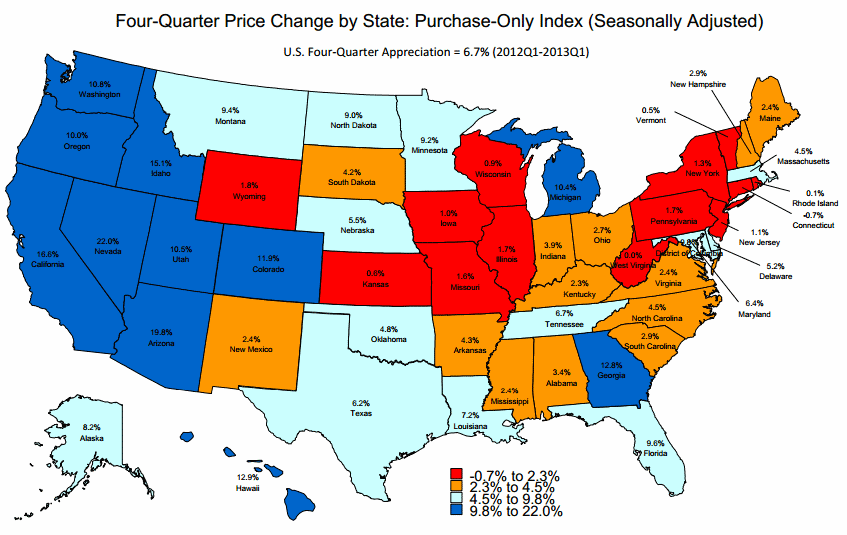
As has every other price-related report, the one issued by the Federal Housing Finance Agency (FHFA) today confirmed the upward momentum of home prices in the first quarter of 2013. FHFA's Home Price Index (HPI) rose 1.9 percent, the seventh consecutive quarter that the seasonally adjusted, purchase-only index has risen.
The 1.9 percent quarter rise may actually understate a growing momentum; the seasonally adjusted index rose 1.3 percent just in March, the last month of the quarter. This was the 14th consecutive increase in the monthly HPI.

Since the first quarter of 2012 home prices have increased 6.7 percent. FHFA points out that the cost of other goods and services have risen 1.4 percent over the last four quarters so the inflation adjusted rise in home prices is 5.2 percent, 3.71 times the overall rate.
"The housing market has stabilized in many areas and homebuilding activity has strengthened in recent quarters," FHFA principal economist Andrew Leventis said. "That said, labor market weakness and still-elevated foreclosure pipelines remain hindrances to a more robust recovery."
The HPI is calculated from home sale price information for mortgages purchased or guaranteed by Fannie Mae and Freddie Mac. FHFA recently added an expanded-data HPI which adds transaction information from county recorder offices and the Federal Housing Administration to regular HPI data. That expanded index also rose 1.9 percent in the first quarter and was up 6.4 percent over the last four quarter.
The agency notes that a new series of "distress-free" home price indices it generated for 12 large metropolitan areas generally report lower quarterly appreciation than do the purchase-only indices. In 11 of the 12 areas the new index, which removes the direct effect of short sales and bank owned properties (REO) shows lower appreciation than the traditional series. For example, for the Atlanta MSA the purchase-only four quarter index appreciation was 17.62 percent; for the distress-free index the appreciation over the same period was 10.3 percent. For Chicago the numbers were 4.26 percent versus 2.9 percent respectively.
The seasonally adjusted purchase-only HPI was up in 41 states and the District of Columbia and increased on both a quarterly and annual basis in all nine census regions. The strongest appreciation was in the Pacific Region which was up 2.3 percent for the quarter and 16.1 percent for the year. No other region came close in annual appreciation - the second greatest increase was 7.5 percent in the South Atlantic region. House prices were weakest in the Middle Atlantic division, up 0.3 percent quarter over quarter and 1.6 percent year-over-year.

Jacksonville, Florida had the largest increase among metropolitan areas, up 9.3 percent on an annual basis while prices were weakest in the Bridgeport, Connecticut market where they fell 3.5 percent since the first quarter of 2012.


