The MBS stack is flat. Financial stocks are leading equity indexes higher this morning.
Morning Econ...dont get too caught up on the fundamental effects of economic data on MBS right now. We already know the economy is bad. What we dont know is how effective the Obama Administration's Housing Plan and Stimulus package will be in slowing the pace of economic contraction.
If you're in a good mood right now you should stop reading here...the data is crappy
Durable Goods
Orders (UGH)
Press Release: http://www.census.gov/indicator/www/m3/adv/index.htm
A key indicator of FUTURE manufacturing activity.
Durable Goods: products that have a life expectancy of at least three years (cars, computers, machinery)
Most economic indicators tell us what happened in the past. Durable goods orders tells us what might happen in the future. Specifically the Durable Goods orders provides an indication of what manufacturing production will take place in upcoming months. When interpreting the orders for factory goods.... a jump in orders indicates factories will remain busy....a fall in orders indicates contracting production. A persistent decline in factory orders is an omen that assembly lines may soon slow to the point that less labor is needed to fulfill production demand. This can lead to laying off workers and possibly even closing down plants.
Excerpts from the Press Release...
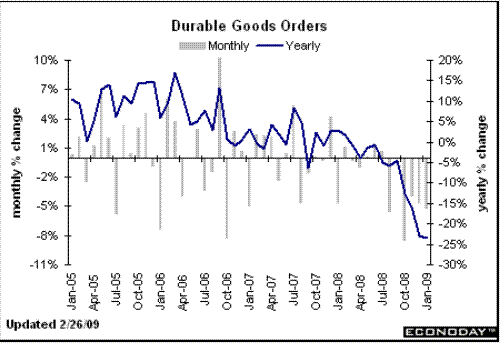
"New orders for manufactured durable goods in January decreased $9.0 billion or 5.2 percent to $163.8 billion, the U.S. Census Bureau announced today. This was the sixth consecutive monthly decrease"
"Shipments of manufactured durable goods in January, down six consecutive months, decreased $6.9 billion or 3.7 percent to $183.1 billion"
"Unfilled orders for manufactured durable goods in January, down four consecutive months, decreased $15.3 billion or 1.9 percent to $785.0 billion. This was the largest percent decrease in unfilled orders since January 2002"
"Inventories of manufactured durable goods in January, down following sixteen consecutive monthly increases, decreased $2.8 billion or 0.8 percent to $340.7 billion."

This is one of those reports that indicates the economy is slipping further into a deflationary spiral. Data like this is why the entire Obama Administration has been preaching gloom and doom and advocating the NEED for more government spending.
Jobless Claims (UGH)
Press Release: http://www.dol.gov/opa/media/press/eta/ui/current.htm
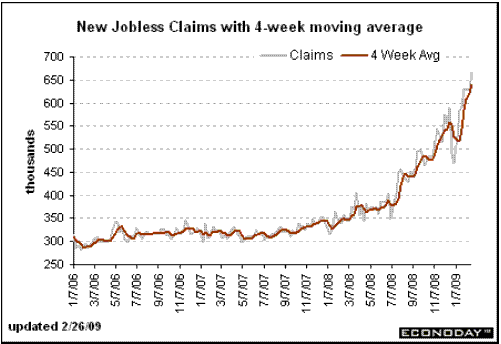
In the week ending Feb. 21, the advance figure for seasonally adjusted initial claims was 667,000, an increase of 36,000 from the previous week's revised figure of 631,000. The 4-week moving average was 639,000, an increase of 19,000 from the previous week's revised average of 620,000.
The advance number for seasonally adjusted insured unemployment during the week ending Feb. 14 was 5,112,000, an increase of 114,000 from the preceding week's revised level of 4,998,000. The 4-week moving average was 4,932,250, an increase of 89,250 from the preceding week's revised average of 4,843,000.
The fiscal year-to-date average for seasonally adjusted insured unemployment for all programs is 4.466 million.
Continuing claims are the worst ever...again this is why the administration continues to advocate government spending. Once they started the spending the market began expecting it...now we rely on it. I think this chart illustrates the severity of the problem in the labor market.

New Home Sales (UGH)
Press Release: http://www.census.gov/const/newressales.pdf
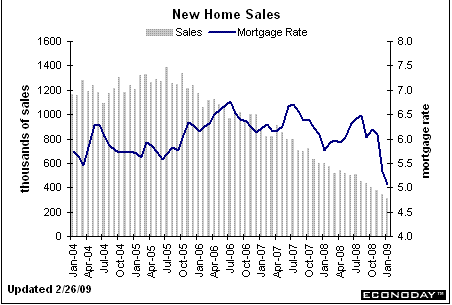
"Sales of new one-family houses in January 2009 were at a seasonally adjusted annual rate of 309,000, according to estimates released jointly today by the U.S. Census Bureau and the Department of Housing and Urban Development. This is 10.2 percent (±15.4%)* below the revised December rate of 344,000 and is 48.2 percent (±6.8%) below the January 2008 estimate of 597,000.
The median sales price of new houses sold in January 2009 was $201,100; the average sales price was $234,600. The seasonally adjusted estimate of new houses for sale at the end of January was 342,000. This represents a supply of 13.3 months at the current sales rate."
I believe a chart is really the best way to illustrate the "crapiness"....

More to come in a few...


